Our latest insights on trends and opportunities taking place in the currency markets

How trade barriers shape inflation, monetary policy, and currency markets
Currency market activity and commentary on Mesirow’s currency for return strategies

How exchange rates influence global travel decisions
The FX market for 2026 will be shaped by central bank policy divergence, foreign relations, and AI investment.
Soros, stablecoins, and what yesterday’s currency crisis reveals about tomorrow's digital collapse.
Currency market activity and commentary on Mesirow’s currency for return strategies.
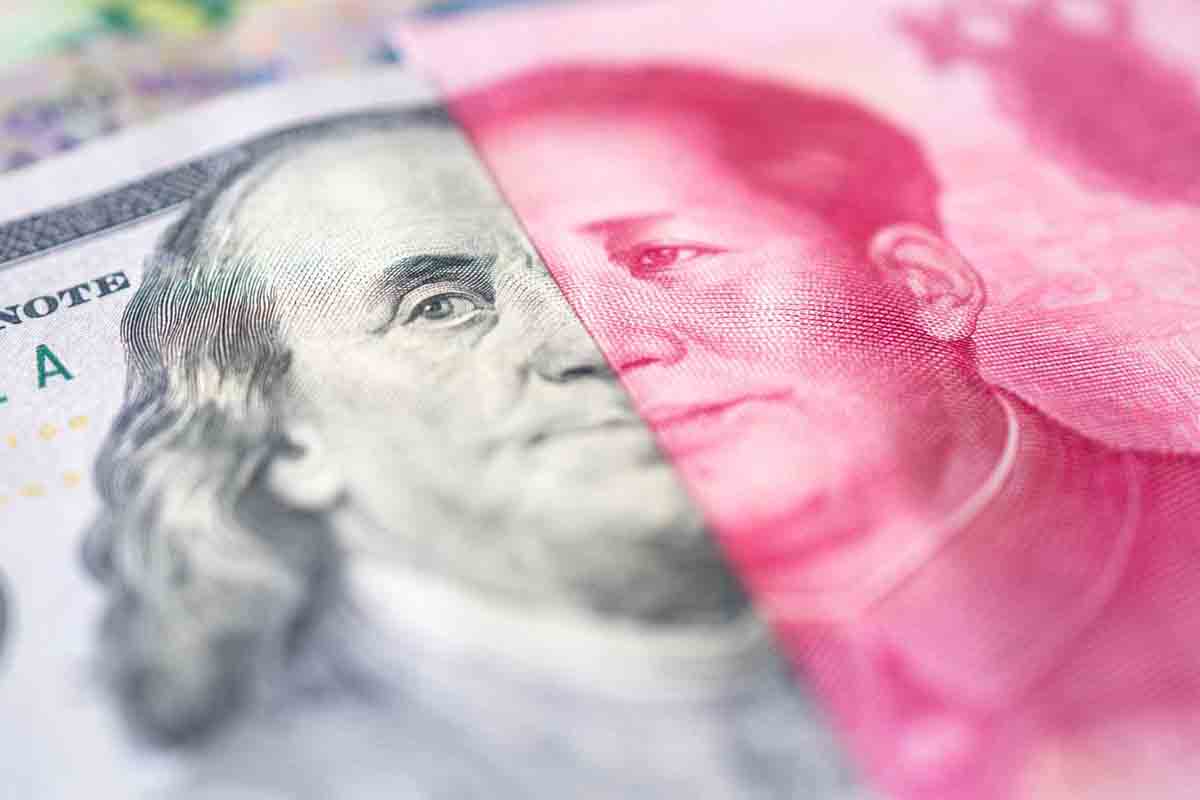
China, India and the EU press on with CBDCs, but the US bets big on private crypto innovation.

How carry trades shape and shake markets
Embedded currency exposure in a portfolio can detract from risk-adjusted returns. Investors should assess how currency exposure impacts their portfolios and consider strategies to manage this risk as a means of enhancing overall portfolio outcomes.
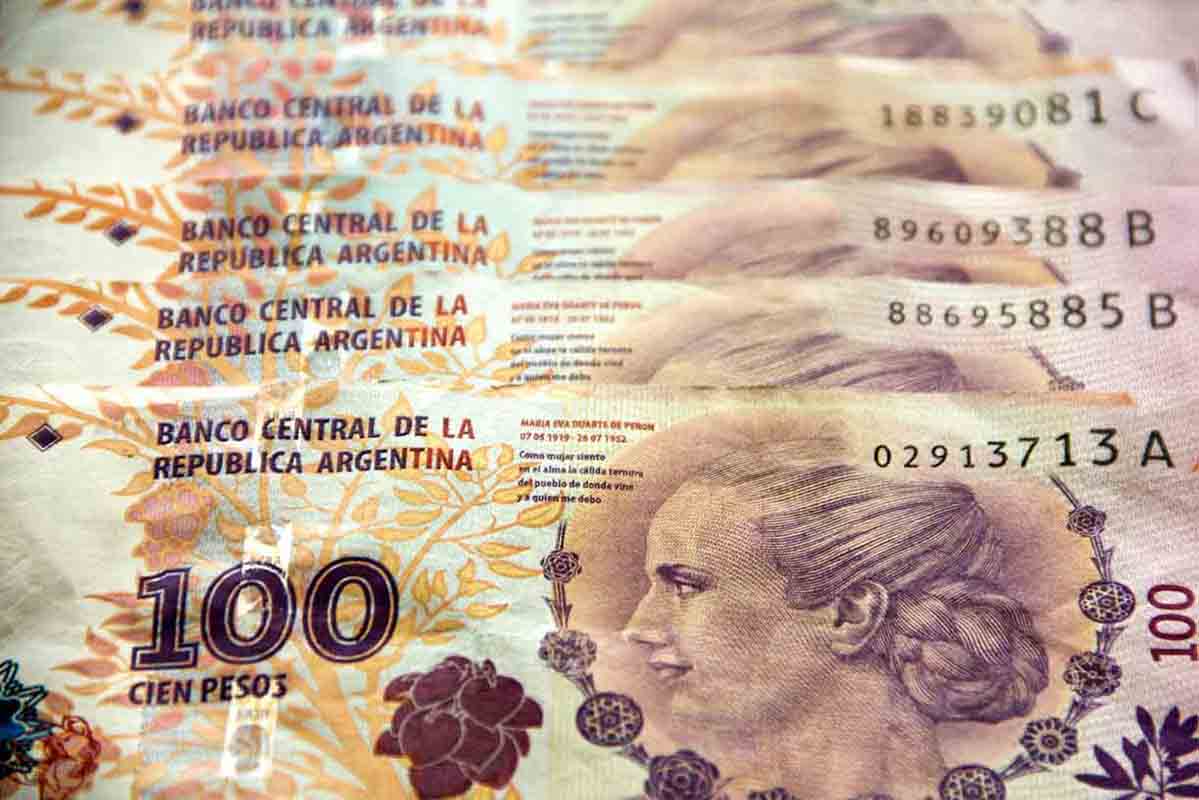
Bailout or bet—can US dollars stabilize a collapsing peso?

A machine learning-based market regime detection and mean reversion strategy
Hedging and speculation with currency futures - understanding the basics
President signs legislation to regulate payment stablecoins, but how stable are they?
Currency market activity and commentary on Mesirow's currency for return strategies
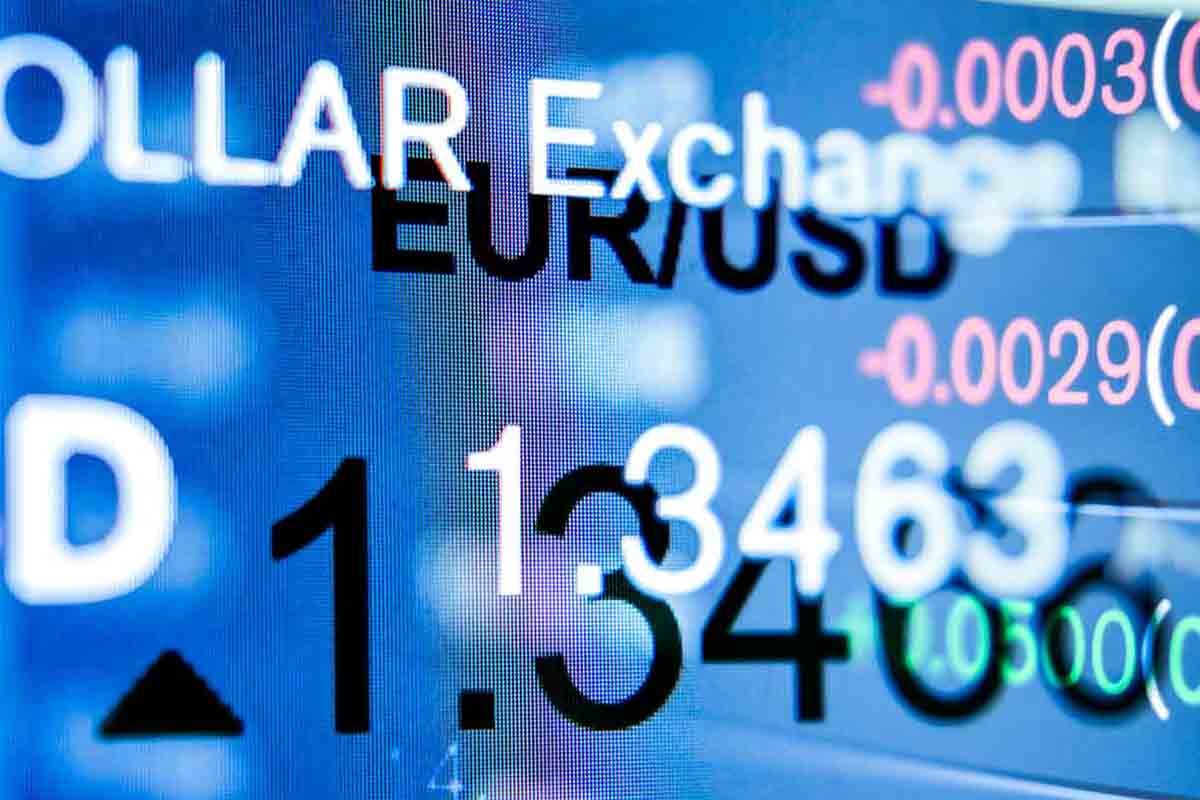
FX benchmark prices are critical for global commerce, investments, and trading, but is there a hidden risk in your favorite FX rate?

Knowing how these rates work, when they're appropriate and their typical uses can lead to smarter financial decisions for importers, travelers or investors.
Free float vs managed float currency exchange rates: which one is better?
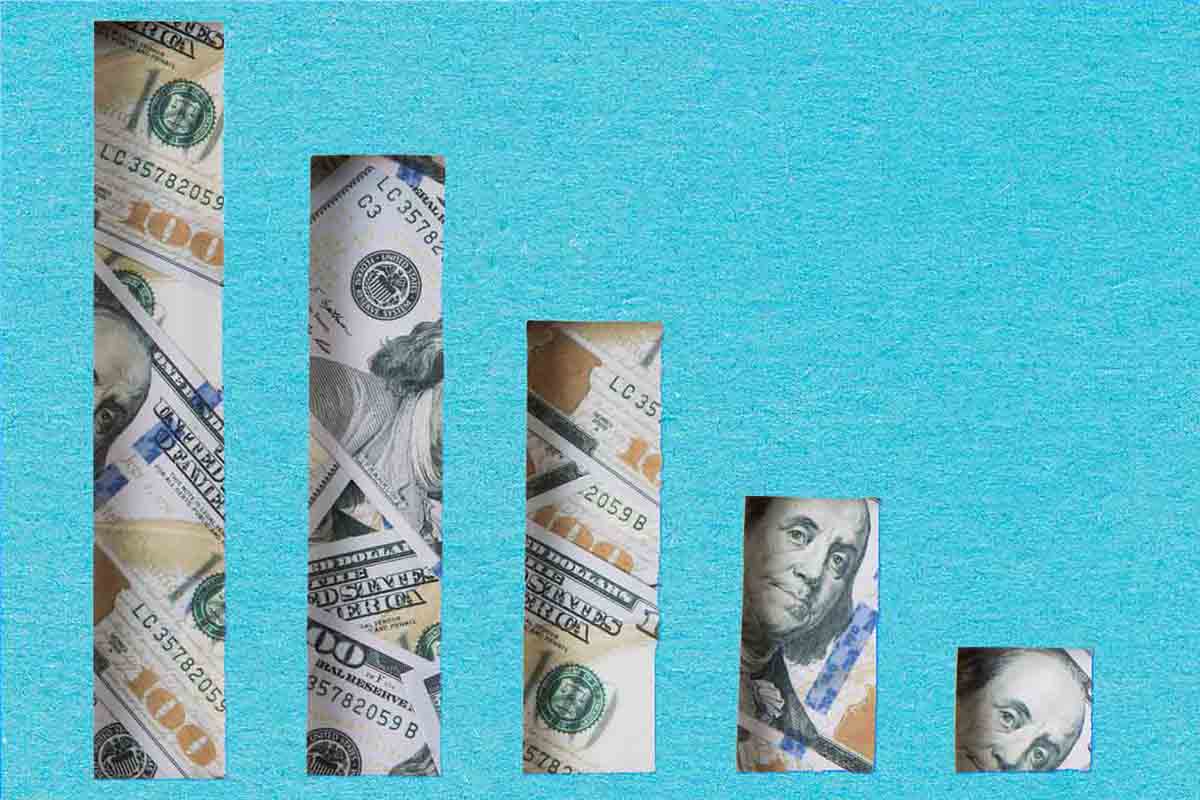
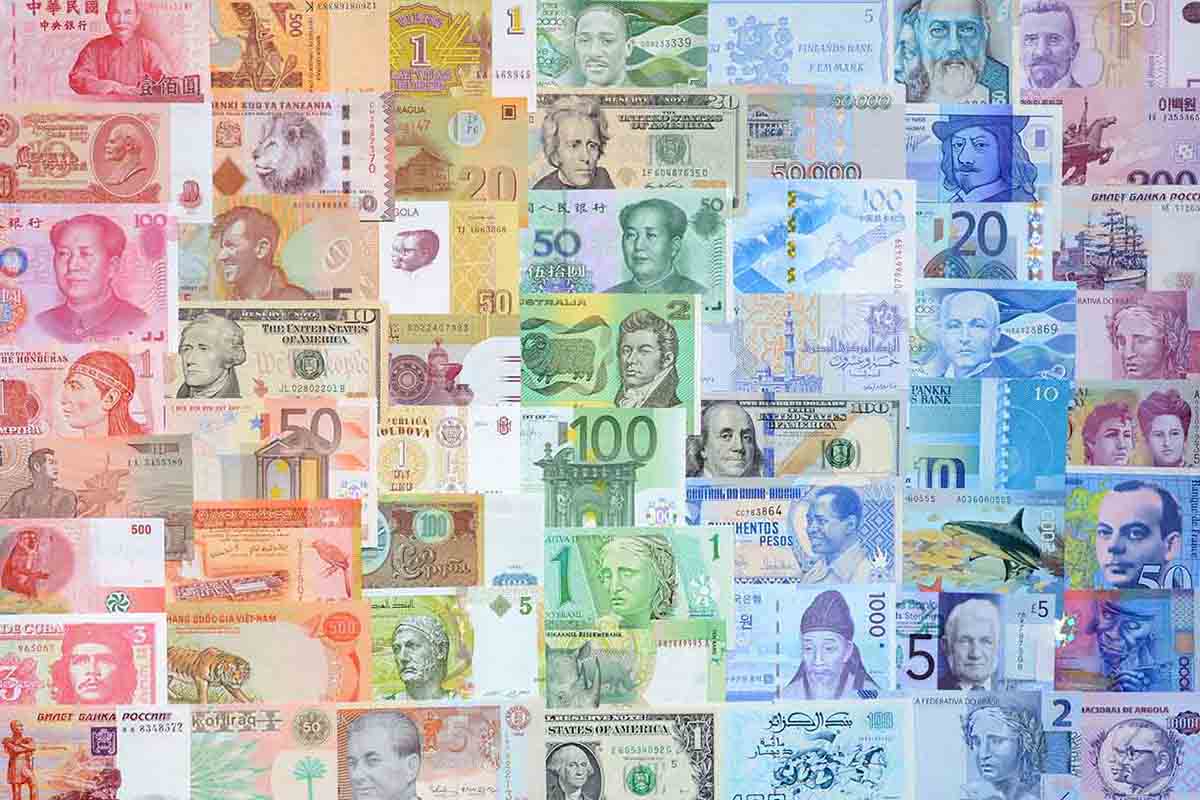
The currency composition of official foreign exchange reserves has changed significantly over the past 25 years. How did the USD ascend and can it hang on to its dominance?
From 1999 to the end of 2024, dollar holdings as reserve currency declined by about thirteen percentage points. Crises and competition challenges USD hegemony as the dominant foreign exchange reserve. How much longer will dollar dominance last?

Why do US and Swiss pension funds use different currency risk strategies?

Currency market activity and commentary on Mesirow's currency for return strategies
Currency market activity and commentary on Mesirow's currency for return strategies

Learning how exchange rates are presented and what they signify can offer a clearer view of the economic trends and market forces shaping currency values.

Keeping an eye on currency trends and information can explain the "why" of economic events that have life-altering consequences for people and nations.

Inflation, the US election, geopolitical uncertainty and FX volatility were major themes in 2024. What might we see in 2025?
Identifying the appropriate liquidity management approach for a currency overlay is a key risk consideration.
US delay to issue a central bank digital currency could have geopolitical implications.

Designed to overcome price volatility and pegged to a single asset or combination of assets, stablecoins aim to become a mainstream medium of exchange.

Currency market activity and commentary on Mesirow's currency for return strategies
Will tariffs and higher taxes be enough to pay for these benefits? Not even close.
Currency market activity and commentary on Mesirow's currency for return strategies

The debt level is approaching its 1946 historic high. Will it take a collapse in the bond or FX market before we take action?

Billions of dollars in transaction savings and economic output. Rapid payment systems pay off.
Since 1990, debt crises have erupted periodically. How could the rising US debt affect the USD? What can be done?

After the Great War, the world attempted to relive gold's glory years. It didn't work.
US securities markets have moved from a settlement period of two days after trading (T+2) to one day (T+1). This change also affects the FX settlement process. What should foreign investors do?

Distributed ledger technology fosters digitization of just about everything

Currency market activity and commentary on Mesirow's currency for return strategies.

Tokenized gold works by digitizing ownership of actual physical gold, making it tradeable on a distributed ledger. Will investors rush to this 21st century treasure?

The benefits of rapid payments (financial inclusion, connectivity, shelter from economic sanctions) have many nations interested in establishing a rapid payments system. Can the US replicate the success of other nations?

Bretton Woods to the Nixon Shock: Gold played a pivotal role in the post-WWII international monetary system.
Potential to increase return while reducing risk by hedging currencies
How did it all begin, and should we reconsider gold as the basis for an international monetary system?

Tenor management can alleviate carry penalties while managing currency risk

Nations are rushing to launch CBDCs. Will the U.S. be a leader or a laggard in the digital currency race?
Currency market inefficiencies may be used in international portfolios to manage risk or pursue higher returns

Analyzing pandemic economic effects and foreign exchange rate movements

Is there an association between ESG government risk & international IPO underpricing?

Environmental, Social, and Governance data as a complementary source in a fundamental strategy

High dimensional data visualisation for systematic FX trading

Deep neural networks for FX prediction
A quarterly email that brings together insights from across the entire Mesirow organization, with perspectives on markets, sectors and investing in what matters.