Insights
Enhancing core plus
Share this article
Introduction
As investment managers, we recognize the fundamental role fixed income investments play in constructing a well-diversified portfolio. However, in the real world, the decision of how best to invest in fixed income is not always easy. In today’s market, bonds are expensive. Yields across the globe are flirting with all-time lows and spreads are the tightest they have been in decades. With this backdrop, allocations to traditional bond strategies have slowed, and investors are searching for new and attractive ways to earn higher yields. The result? An increased interest in Core Plus and related styles of investing.
On its surface, Core Plus is not a new concept. However, as the spotlight shines even brighter on the strategy and investors become more discerning, our first goal in this discussion is to vet the merit of “Core Plus”. In this endeavor, we evaluated the Core Plus concept through the lens of Markowitz’ Modern Portfolio Theory1. The resulting data, consistent with Markowitz’ argument, makes a strong case for incorporating more credit into fixed income products.
After establishing the validity behind the Core Plus proposition, we next sought to determine if any incremental opportunity for improvement existed. We studied other asset classes and found currency stood out as a compelling complement to a “Core” portfolio. As one might expect, adding currency took our “Core Plus” model to a new level, increasing returns while simultaneously decreasing risk (volatility)2. We will explain in greater detail why this was the case, and what benefits a currency strategy offers to traditional Core Plus investing.
Finally, we tie together this research and introduce Enhanced Core Plus (“ECP”), Mesirow’s latest solution to help investors seeking new avenues for higher yield, lower correlations and a similar risk profile to their historical traditional fixed income portfolios.
Does a greater use of credit make Core better?
Though “Core Plus” is a broad term, the difference between “Core” and “Core Plus” is typically the addition of credit. The question must then be asked – “is the investor better off with this new allocation?” On the face of it, the strategy sounds riskier.
CHART 1: Average % of Portfolio, Calculated Credit Quality
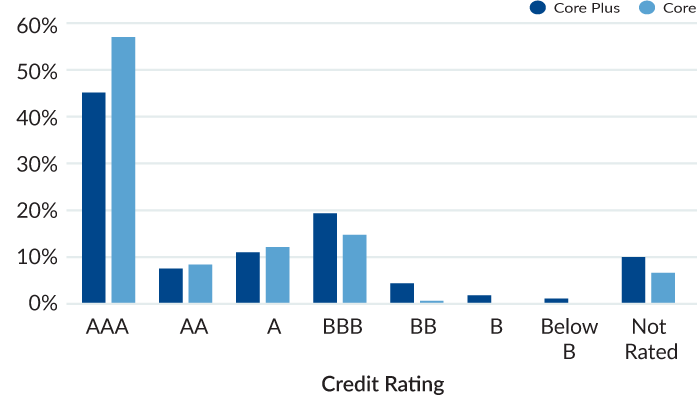
Source: Morningstar Direct. Morningstar defines their Core style as portfolios that have less than 5% allocated to below-investment grade investments. Their Core Plus styles allow more flexibility to hold noncore sectors such as corporate high yield, bank loan, emerging-markets debt, and non-U.S. currency exposures, and typical have higher exposures to lower tier credits. https://www.morningstar.com/articles/929313/12-charts-on-morningstars-new-us-core-bond-categories
To evaluate this, we used Harry Markowitz’ Modern Portfolio Theory (MPT). Developed in the 1950s, Markowitz created a framework for portfolio construction based on maximizing returns while minimizing volatility (risk). In particular, Markowitz’ work focused on an investor’s ability to diversify away risk through the management and reduction of correlation between the returns of asset classes.
Table 1
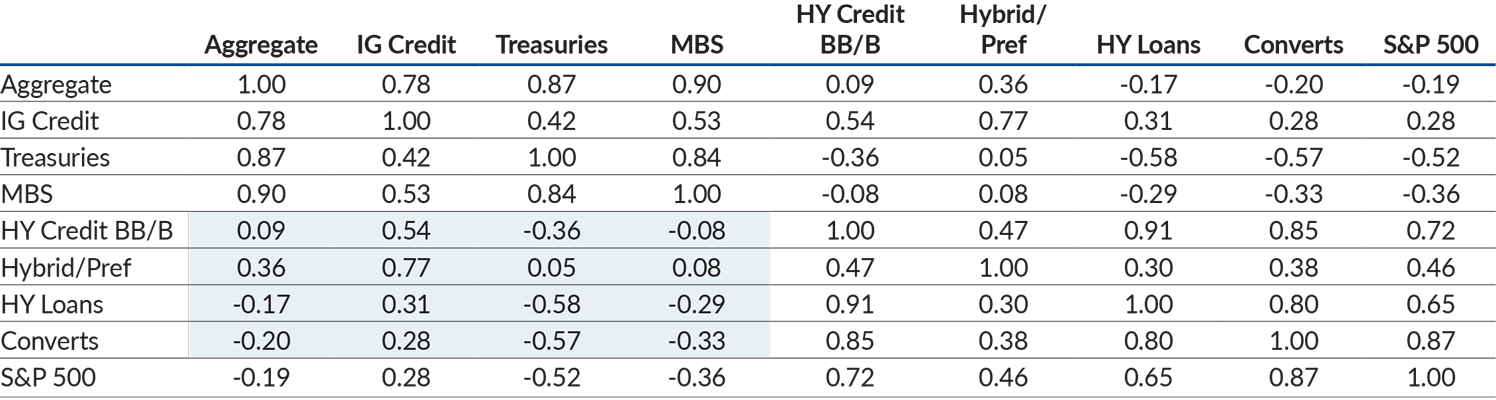
Source: Bloomberg. Data from 3/2004–6/2019
After reviewing historic correlations, the decision to add fixed income credit to an Investment Grade portfolio appears compelling. Most credit assets that offer incremental yield (high yield credit, high yield bank loans, hybrid/preferreds) have correlations that are low in relation to the Bloomberg Barclays US Aggregate Bond Index, the standard benchmark in fixed income portfolios. Based on Markowitz, the addition of these asset classes should allow better portfolio performance and more stable returns. This can also be visually demonstrated in the shift of the efficient frontier (another application of Markowitz) seen below.
Chart 2
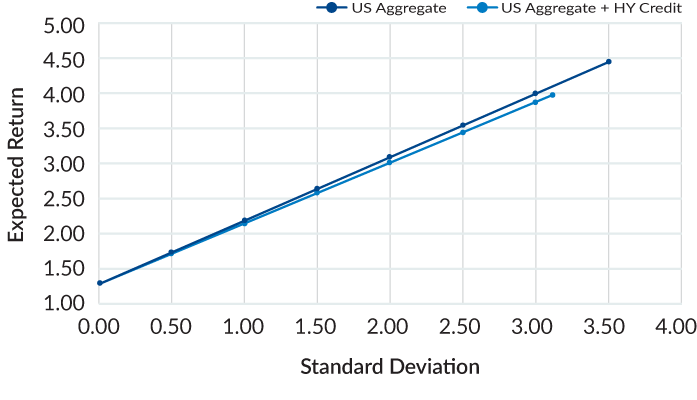
The mean variance optimization was run with the following constraint: the US Aggregate + HY Credit portfolio could hold no more than a 20% allocation in high yield. This 20% limit was incorporated so the analysis would mimic a typical “core plus” portfolio. Source: Bloomberg. Bloomberg Barclays US Aggregate Bond Index, Bloomberg Barclays US Corporate High Yield Ba Bond Index and FTSE 3-Month T-Bill 4/2004–6/2019
In the graph, we compare the efficient frontier of two portfolios – the first represents the Bloomberg Barclays US Aggregate Bond Index (the “Aggregate”), the second represents a portfolio that allows up to a 20% allocation of the Bloomberg Barclays Ba High Yield Corporate Credit Index. As seen above, the addition of credit shifts the curve out meaningfully. This new portfolio mix, which is meant to replicate a typical “Core Plus” portfolio, receives more expected return while the risk (or standard deviation) remains the same or lower across the spectrum of possible returns.
The performance difference maker – Currency Alpha
If adding a lesser-correlated asset such as credit can create such a dramatic shift in the efficient frontier, it stands to reason that investment managers could search for additional asset classes that can add non-correlated returns to their portfolio. It is for that reason that we believe currency strategies could be the next game changer in fixed income portfolio management.
Currency is a long-established asset class in the financial world but is often overlooked by investors due to unfamiliarity, complexity and perceived volatility. It is also often viewed only in the lens of hedging. However, the uniqueness of currency as an asset screams opportunity due to its low correlations to traditional asset classes. If asset managers can harness currency’s potential, an improved portfolio should typically be the result.
To test this theory, we studied Mesirow’s Currency Alpha Extended Markets Strategy.
A few critical elements to note on the Extended Markets strategy:
Alpha Strategy, Not Hedge – The Extended Markets strategy is an alpha strategy, and stand-alone management of currency exposure. (This is important to note because it establishes the management extends beyond hedging.)
Components – There are many different methods of constructing currency strategies, so it is also necessary to specify the details of the strategy. Mesirow’s Extended Markets Strategy uses a broad basket of global currencies and allocates capital between fundamental and technical strategies to drive returns.
Controlled volatility – Mechanisms are instilled in the strategy to reduce downside tail risk.
Table 2
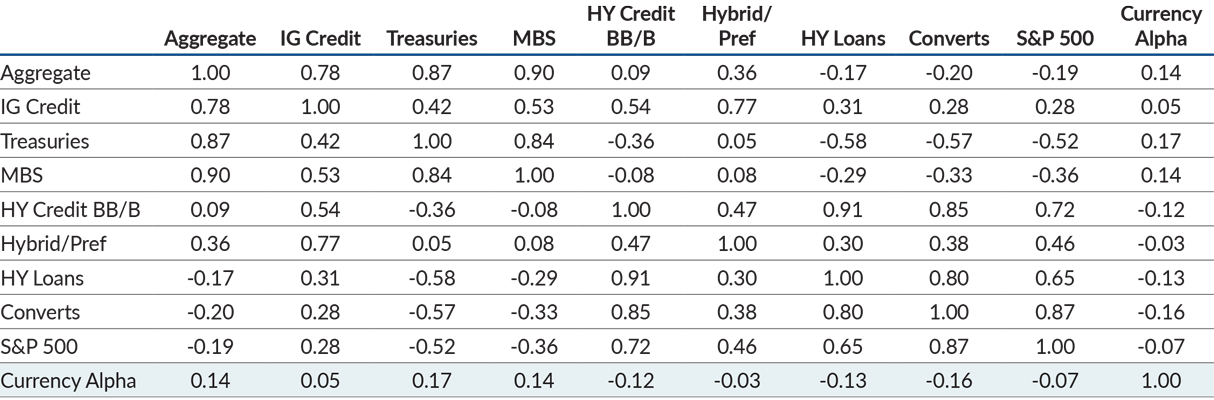
Source: Bloomberg, eVestment. Data from 3/2004–6/2019
First, we examined whether the strategy harbored any hidden correlations with other asset classes. Then we incorporated the currency strategy’s historical returns into the Core Plus portfolio modeled above to establish currency’s impact.
To test correlation, we analyzed historic monthly returns through the inception date of the Extended Markets strategy. As suspected, the strategy showed almost no correlation to other market segments.
Then we incorporated the currency strategy’s historical returns into the Core Plus portfolio modeled above to view currency’s impact.
CHART 3
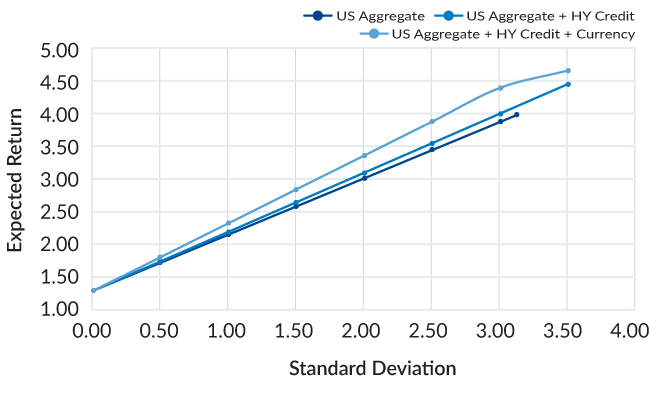
The mean variance optimization was run with the same constraints outlined in Chart 2, plus an additional constraint that the US Agg + HY Credit + Currency portfolio could hold no more than a 20% allocation combined towards high yield and currency strategies. Source: MFIM*, Bloomberg. Bloomberg Barclays US Aggregate, Bloomberg Barclays US Corporate High Yield Ba, FTSE 3-Month T-Bill 4/2004–6/2019
As expected, adding a non-correlated asset once again shifted the efficient frontier. Incorporating a currency alpha allocation to our “Core Plus” portfolio improved returns greatly while maintaining the same standard deviations. It is for this reason that we believe that an appropriate currency strategy can create a radically new fixed income strategy, which is the basis of Mesirow’s new appropriately named, “Enhanced Core Plus”.
Our conclusion
We believe the strength of the historic numbers speak for themselves. There appears to be a strong case for a strategy that integrates core fixed income with credit and currency alpha.
While Mesirow’s Enhanced Core Plus (“ECP”) strategy just launched in October 2019, the building blocks of the strategy and modeled results make a strong case for its differentiation in the fixed income asset class.
Table 3
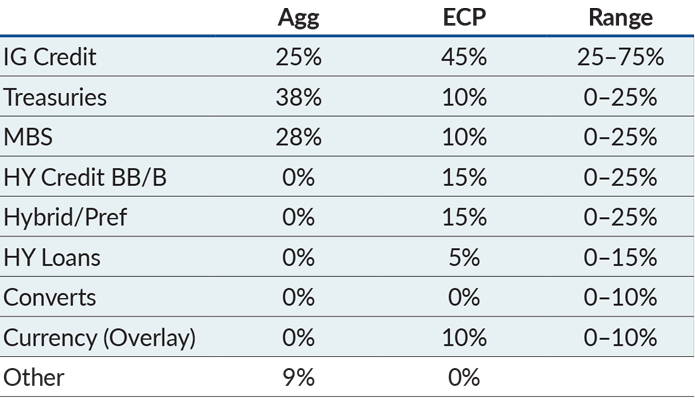
Source: Bloomberg Barclays, MFFI
Chart 4: Allocation
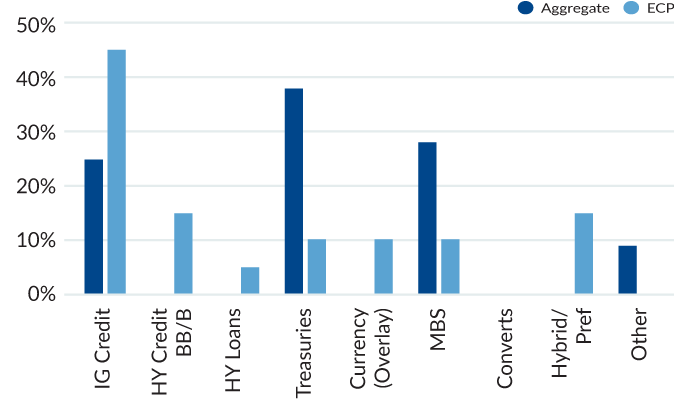
Source: Bloomberg Barclays, MFFI
Model results also echo a similar sentiment. We back-tested ECP’s standard allocation through 2000, which produced attractive returns throughout the period, including before and after the 2008/2009 financial crisis. The model outperformed the Bloomberg Barclays US Aggregate by 129bps and generated a Sharpe ratio of 1.19 versus 0.96 for the index.** These are findings that we believe are compelling and are consistent with having the components to create an even more optimal efficient frontier for many fixed income portfolios.
1. Harry Markowitz, “Portfolio Selection” Journal of Finance (1952)
2. Please note that model, hypothetical and/or simulated performance information do not reflect actual results and portfolio outcomes may differ based on the impact of material economic or market factors and the benefit of hindsight. Please see page four for complete model disclosure information.
Mesirow Financial refers to Mesirow Financial Holdings, Inc. and its divisions, subsidiaries and affiliates. The Mesirow Financial name and logo are registered service marks of Mesirow Financial Holdings, Inc. © 2020. All rights reserved. The information contained herein is intended solely for institutions and for informational purposes only. Said information has been obtained from sources believed to be reliable, but is not necessarily complete and its accuracy cannot be guaranteed. Any opinions expressed are subject to change without notice. It should not be assumed that any recommendations incorporated herein will be profitable or will equal past performance. Mesirow Financial Investment Management, Inc., (“MFIM”) an SEC-registered Investment Advisor, and its division, Mesirow Financial Fixed Income (“MFFI”) and other affiliated companies and/or individuals may, from time to time, own, have long or short positions in, or options on, or act as a market maker in, any securities discussed herein and may also perform financial advisory or investment banking services for those companies. Nothing contained herein constitutes an offer to sell or a solicitation of an offer to buy an interest in any Mesirow Financial investment vehicle. A complete list of composites can be made available upon request. Information is provided in terms of U.S. dollar denominations. Mesirow Financial does not render tax or legal advice. Please consult your tax professional prior to making any investment decisions. Any chart, graph, or formula should not be used by itself to make any trading or investment decision. Account performance information pertaining to Mesirow Financial Investment Management, Inc. is attributable only to MFIM accounts managed on a discretionary basis. Performance information that is provided gross of fees does not reflect the deduction of advisory fees. Client returns will be reduced by such fees and other expenses that may be incurred in the management of the account. Advisory fees are described in Form ADV Part 2 of Mesirow Financial Investment Management, Inc. Performance results include the reinvestment of dividends and earnings in the composite. Additional information regarding policies and procedures for calculating and reporting returns is available upon request.
* The Extended Markets Currency Alpha Strategy (Extended Alpha Strategy) commenced trading in April 2004 as a carve-out from an institutional account. From April 2004 through December 2010 performance is based on an equal weighted composite of all accounts invested in the Extended Alpha Strategy; from January 2011 performance is based on the asset weighted performance of all accounts invested in that strategy. Performance fees are accrued daily, paid quarterly and a high water mark is employed. Performance is in USD and all returns and statistics are based on monthly returns. The composite includes all fee paying accounts, including both commingled and managed accounts. Currency trading may involve instruments that have volatile prices, are illiquid or create economic leverage. Emerging markets securities involve risks such as currency fluctuation and political and economic instability that could result in additional volatility. Unhedged short sales expose the strategy to additional liability.
** Model, hypothetical and/or simulated performance information and results do not reflect actual trading or asset or fund advisory management and the results may not reflect the impact that material economic and market factors may have had, and can reflect the benefit of hindsight, on MFIM’s decision-making if MFIM were actually managing client’s money. Any securities contained or investment strategies used in the model performance results provided herein do not relate or only partially relate to the advisory services currently offered by MFIM. MFIM’s clients may have had results materially different from the results provided. Any Probability Weighted Return performance information contained in this presentation is hypothetical and clients should not expect to achieve same or similar results and may achieve materially different results. Any listing of representative clients was not selected based on specific performance criteria but rather lists significant institutional relationships. We do not represent that any client listed specifically approves or disapproves of our advisory services.
The Bloomberg Barclays U.S. Aggregate Index represents securities that are SEC-registered, taxable, and dollar denominated. The index covers the U.S. investment grade fixed rate bond market, with index components for government and corporate securities, mortgage pass-through securities, and asset-backed securities. These major sectors are subdivided into more specific indexes that are calculated and reported on a regular basis. The Bloomberg Barclays Intermediate Aggregate Index includes securities in the intermediate maturity range of the Aggregate Index. The Bloomberg Barclays Intermediate Government/Credit Index is the intermediate component of the U.S. Government/Credit index. The Bloomberg Barclays 1-3 Year Government/Credit Index includes securities in the U.S. Government/Credit Index with a maturity from 1 up to (but not including) 3 years. The Bloomberg Barclays Government/Credit Index includes securities in the Government and Credit Indices. The Bloomberg Barclays Government Index includes treasuries (i.e., public obligations of the U.S. Treasury that have remaining maturities of more than one year) and agencies (i.e., publicly issued debt of U.S. Government agencies, quasi-federal corporations, and corporate or foreign debt guaranteed by the U.S. Government). The Bloomberg Barclays Treasury Index is the U.S. Treasury component of the U.S. Government index and includes public obligations of the U.S. Treasury with a remaining maturity of one year or more. The Bloomberg Barclays Agency Index is the U.S. Agency component of the U.S. Government/Credit index. The index includes both callable and noncallable agency securities. The Bloomberg Barclays Mortgage-Backed Securities Index covers the mortgage-backed pass-through securities of Ginnie Mae (GNMA), Fannie Mae (FNMA), and Freddie Mac (FHLMC). This index is the U.S. MBS component of the U.S. Aggregate index. The Bloomberg Barclays Intermediate Credit Index is the Intermediate component of the U.S. Credit Investment Grade Index that have a maturity from 1 up to (but not including) 10 years. The Bloomberg Barclays U.S. Credit Index is the same as the former U.S. Corporate Investment Grade Index, which has been renamed as the U.S. Credit Index. The Credit Index includes both corporate and non-corporate sectors. The corporate sectors are Industrial, Utility, and Finance, which include both U.S. and non-U.S. corporations. The non-corporate sectors are Sovereign, Supranational, Foreign Agency, and Foreign Local Government. The Bloomberg Barclays Asset-Backed Securities Index is the ABS component of the U.S. Aggregate index. The Asset-Backed Securities (ABS) Index has three subsectors (credit and charge cards, autos and utility) and includes pass-through, bullet, and controlled amortization structures. The Bloomberg Barclays CMBS ERISA-Eligible Index is the ERISA-eligible component of the Bloomberg Barclays CMBS Index. This index, which includes investment grade securities that are ERISA eligible under the underwriter’s exemption, is the only CMBS sector that is included in the Bloomberg Barclays U.S. Aggregate Index. This index is the CMBS component of the U.S. Aggregate index. The Bloomberg Barclays U.S. High Yield Index covers the universe of fixed rate, non-investment grade debt and includes both corporate and non-corporate sectors. The Conference Board Leading Economic Index is an American economic leading indicator intended to forecast future economic activity. It is calculated by The Conference Board, a non-governmental organization, which determines the value of the index from the values of ten key variables. The Bloomberg U.S. Financial Conditions Index (BFICUS) provides a daily statistical measure of the relative strength of the U.S. money markets, bond markets, and equity markets, and is considered an accurate gauge of the overall conditions in U.S. financial and credit markets. The Bloomberg Barclays US Corporate High Yield Bond Index measures the USD-denominated, high yield, fixed-rate corporate bond market. Securities are classified as high yield if the middle rating of Moody’s, Fitch and S&P is Ba1/BB+/BB+ or below. Bonds from issuers with an emerging markets country of risk, based on Barclays EM country definition, are excluded.
Securities offered through Mesirow Financial, Inc. member FINRA, SIPC. Individual and Corporate Insurance Services provided by Alliant Mesirow Insurance Services.
Spark
Our quarterly email featuring insights on markets, sectors and investing in what matters