Insights
The great monetary reflation
Share this article
The secular shift to value
In June 2020 we published an article titled “The Great Monetary Reflation, The Secular Shift to Value.” We highlighted the unprecedented magnitude of the fiscal and monetary response to the COVID-19 crisis and examined how the size and impact of the response could affect asset returns particularly through higher inflation and economic growth. In August at the Jackson Hole Symposium, Federal Reserve Chairman Jerome Powell announced changes to the FED’s monetary policy framework which are incrementally supportive of our “Great Monetary Reflation” thesis. While the modifications were expected and are consistent with recent FED commentary, we believe the ramifications will have real long-term consequences to investors’ views of monetary policy impact.
The FED has always had two mandates (full employment and price stability). Historically, these have been managed to specified targets. However, the recent policy statements from the FED implies a softer, less rigid approach to meeting these mandates. The most notable adjustment is the shift to an average inflation target of 2% which will allow inflation to run above 2% for a longer period of time to offset periods where inflation runs lower than target levels. The FED also made changes to their policies around maximum employment, noting that a robust job market can be sustained without a strong pickup in inflation and highlighting the economic and social benefits to low income communities from reaching higher levels of employment. The implications of these actions are that the FED will allow inflation and growth to run higher and longer than usual before implementing restrictive monetary policy. We believe higher inflation and growth will benefit small cap value companies (Figure 1).
In our prior piece, “The Great Monetary Reflation”, we discussed the magnitude of the proposed fiscal and monetary response by the U.S. Federal Reserve and U.S. Treasury, a response that could total a staggering $9.5T and over 44% of GDP. We believe the recent FED actions discussed at Jackson Hole in addition to the aforementioned stimulus will result in inflationary pressures once economic growth returns. Furthermore, in the time since publishing our piece, the performance of asset classes have confirmed the expectations we previously established in our thesis.
Since the market bottom in early Spring of 2020, the CRY Commodity Index has increased 44% through August, moving higher along with the surge in M2 money supply while the US dollar is down about 10%. Real interest rates have fallen to roughly -1.5% as 5-year breakeven inflation expectations have risen, materially, from 0.2% in mid-March to 1.9% currently as a result of FED purchases keeping overall yields low (Figure 2).
Figure 1: Higher growth and/or inflation benefits small cap value As of June 30, 2020
Small Cap Value vs. Small Cap Growth – Inflation

Small Cap Value vs. Small Cap Growth – GDP

The above chart reflects Small Cap Value performance less Small Cap Growth performance in a variety of environments. Small Cap Value outperforms in years when inflation is greater than 2% and/or GDP is greater than 3%.
Source: Furey Research Partners, MFEM. Median Annual Relative Returns (1930-2017). Past performance is not indicative of future results.
Figure 2: Inflation vs. Real Rates
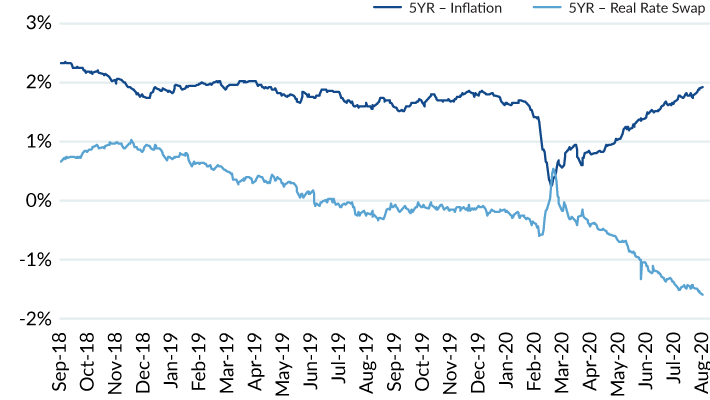
Source: MFEM and Bloomberg. Past performance is not indicative of future results. Please see the disclosures at the end of this presentation for additional, important information and for benchmark/index definitions.
While commodities have performed strongly, so have growth stocks as they are primarily long duration assets benefiting from weaker economic growth and lower real interest rates which has caused positive convexity in the price/earnings ratio in the market (Figure 3). Value stocks, contrarily, are short duration assets that benefit from faster economic growth, higher inflation, and higher interest rates so performance has been more mixed despite expectations for a bounce in GDP growth of 20%-30% in Q3-2020. For value stocks to outperform on a more consistent basis going forward, it is likely that expectations around inflation need to continue to rise and the economic recovery needs to be sustained for several quarters, resulting in higher interest rates that will result in more P/E compression for long duration assets. This could occur if the more relaxed FED policy on inflation and employment combined with higher fiscal spending transmits into the real economy and causes monetary velocity to normalize from long-term lows (Figure 4).
Figure 3: Implied P/E vs Real 10YR Yields (Assuming Static Risk Premium)
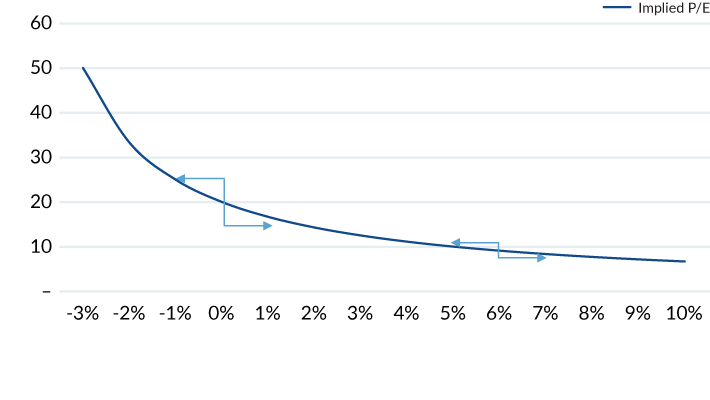
Data as of June 30, 2020. Source: MFEM and Bloomberg. Past performance is not indicative of future results. Please see the disclosures at the end of this presentation for additional, important information and for benchmark/index definitions.
Figure 4: Money supply growth (LH) vs. Monetary velocity (RH) As of June 30, 2020
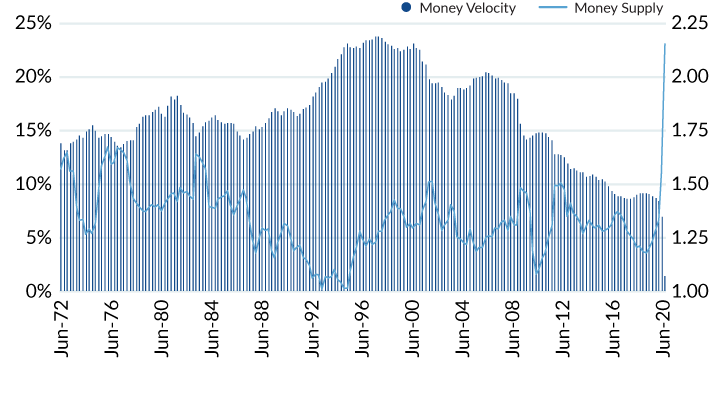
Source: MFEM, Bloomberg and FTSE Russell. The S&P 500 is a stock market index that tracks the stocks of 500 large-cap U.S. companies. Past performance is not indicative of future results.
Mesirow refers to Mesirow Financial Holdings, Inc. and its divisions, subsidiaries and affiliates. The Mesirow name and logo are registered service marks of Mesirow Financial Holdings, Inc. ©2020. All rights reserved. Mesirow Financial Equity Management (“MFEM”) is a division of Mesirow Financial Investment Management, Inc., (“MFIM”) an SEC-registered investment manager. Effective April 1, 2016, Mesirow acquired Fiduciary Management Associates, LLC (“FMA”) which is now an integral part of MFEM. This communication is for institutional use only and may contain privileged and/or confidential information. It is intended solely for the use of the addressee. If this information was received in error, you are strictly prohibited from disclosing, copying, distributing or using any of this information and are requested to contact the sender immediately and destroy the material in its entirety, whether electronic or hardcopy. Nothing contained herein constitutes an offer to sell or a solicitation of an offer to buy an interest in any Mesirow investment vehicle. The information contained herein has been obtained from sources believed to be reliable, but is not necessarily complete and its accuracy cannot be guaranteed. Any opinions expressed are subject to change without notice. It should not be assumed that any recommendations incorporated herein will be profitable or will equal past performance. Model, theoretical or hypothetical performance information and results do not reflect actual trading or asset or fund advisory management and the results may not reflect the impact that material economic and market factors may have had, and can reflect the benefit of hindsight, on MFEM’s decision-making if MFEM were actually managing client’s money. Any chart, graph, or formula should not be used by itself to make any trading or investment decision. Mesirow Financial Investment Management, Inc. and its affiliated companies and/or individuals may, from time to time, own, have long or short positions in, or options on, or act as a market maker in, any securities discussed herein and may also perform financial advisory or investment banking services for those companies. Mesirow does not provide tax or legal advice. Securities offered through Mesirow Financial, Inc. member FINRA, SIPC.
Benchmark Definition: The S&P 500® is widely regarded as the best single gauge of large-cap U.S. equities. There is over USD 9.9 trillion indexed or benchmarked to the index, with indexed assets comprising approximately USD 3.4 trillion of this total. The index includes 500 leading companies and covers approximately 80% of available market capitalization. Please see the following GIPS disclosure for additional benchmark definitions.
The TR/CC CRB Excess Return Index (CRY) is an arithmetic average of commodity futures prices with monthly rebalancing.
Spark
Our quarterly email featuring insights on markets, sectors and investing in what matters