There are approximately 180 currencies in the world and eight major ways for countries to manage the value of their currency. Management often takes the form of influencing currency exchange rates, the value of one currency relative to another. That influence can range from no or minimal intervention (free floating currency exchange rates) to tight government management (capital controls with fixed rates). Which management forms do the nations with the highest currency trade volumes use?
The Bank for International Settlements, a bank for the world's central banks, surveys the foreign exchange market in April every three years and reports currency trade volumes. Table 1 and Figure 1 present currencies with over 5 percent of the global volume traded in the 2022 survey.
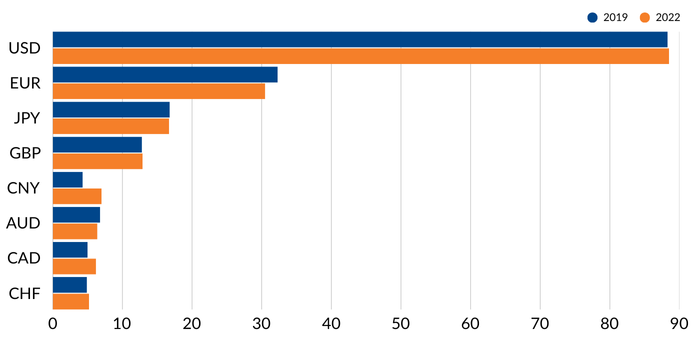
Seven of the top eight currencies in the BIS survey are free floating. Free-floating currencies are those whose exchange rates fluctuate in response to supply and demand. In 2019 and 2022, the US dollar was on one side of about 88% of all currency trades, far outpacing the next most traded currency, the euro. Other free-floating currencies are those of countries that are important participants in the global economy with diversified economies and well-developed capital markets.
Free floating currencies don't work for all countries - some like to manage their exchange rates for reasons political (align with global regional objectives) or economic (more competitively priced exports). A managed float, like that used for the Chinese renminbi, is one way to let a currency exchange rate fluctuate within an acceptable range.
China has taken great strides to make its currency more appealing for international commerce and reserve currency constituency. The success of those efforts is indicated by the increase of the renminbi from 4.3 percent of the global currency volume traded in 2019 to 7.0 percent in 2022. The renminbi vaulted from eighth place in the 2019 survey to fifth place in 2022.
Let's look at the two currency management techniques of the top five nations having the highest volumes traded – free floating and managed float.
Free-floating currencies were borne out of the collapse of the post-World War II financial order in which gold was converted to US dollars at $35 per ounce. Other nations maintained their currencies at a fixed exchange rate with the dollar.
These gold-to-dollars-to-other-currencies exchange rates lasted until the early 1970s when economic conditions made it increasingly difficult for the United States to support the fixed gold-to-dollar rate. When it became apparent that the US would not maintain the gold price of a dollar, currency speculators turned up the pressure on the dollar. In response, the US and other governments let their currencies float in 1973.
Free floating doesn't mean that intervention never occurs. Central banks and treasuries can and do buy and sell their currencies to manage economic situations. The Bank of Japan bought $43 billion of yen to stabilize the dollar-yen exchange rate in 2022, a response to the US central bank's aggressive interest rate hikes.
In the first half of the 2010s, the Swiss National Bank infamously managed the Swiss franc – euro exchange rate to make Swiss exports cheap for Europeans. The infamy occurred in January 2015 when the SNB suddenly ceased managing the exchange rate, causing the franc to soar and the euro to crash.
The United States is not thought to intervene frequently in the currency markets, but that doesn't mean that monetary actions by the US don't affect its currency. In the aftermath of the global financial crisis from late 2007 to mid 2009, the US central bank bought enormous quantities of mortgage-backed securities and government bonds, increasing the supply of US dollars and affecting its currency rate. Some nations, whose currencies are pegged to the US dollar, complained that the monetary actions by the US Federal Reserve caused inflation to rise in their nations, putting them at an economic disadvantage (See notes 140 – 145 in wikipedia.org/wiki/Quantitative_easing#cite_note-140).
Free-float currencies offer several advantages:
Self-correcting adjustments | The currencies adjust to economic situations such as unbalanced trade or capital flows. If a nation has a trade deficit, then its currency could depreciate to make imports more expensive and exports cheaper, reducing the gap between imports and exports.
Monetary policy | A flexible exchange rate allows a central bank to set interest rates without the concern that a central bank would have if its currency exchange rate was fixed. Changing interest rates could alter the demand for the currency, pressuring the fixed rate.
Safe haven | A floating currency can act as a buffer against external shocks. In tumultuous times, investors turn to safe haven currencies like the US dollar and Swiss franc then buy government bonds, driving prices up and yields down. A stronger dollar or franc can make imports cheaper.
Lower foreign exchange reserves | A floating exchange rate means a central bank can keep smaller amounts of foreign currencies compared to those banks which must defend a fixed exchange rate. Lower amounts of foreign reserves reduce costs and increase efficiency.
And because nothing is perfect, disadvantages of a floating exchange rate:
Unanticipated volatility | A free floating currency can be volatile causing investors and businesses to delay investment or business activity while the currency is unsettled.
Inflation | If a country is dependent upon imports, a depreciating currency can increase inflation, making those imports more expensive.
Safe haven | A safe haven currency offers advantages, but a strengthening currency can make exports more expensive.
Debt | If a nation issues debt in a foreign currency, principal and debt repayments can be expensive if the domestic currency depreciates.
Before 2005, China pegged the renminbi rate to the US dollar. In July 2005, the People's Bank of China, the country's central bank, announced China would use a managed floating exchange rate in which the renminbi would be allowed to float in a narrow margin (+/- 2%) around a fixed base rate. The Chinese central bank determines that fix rate each day based on market supply and demand with reference to an unspecified basket of currencies.
China aims to achieve economic and political benefits from its currency management strategy. One is public trust in the country's financial system. A stable currency can lead to increased investment confidence on behalf of its citizens or foreigners resulting in a lower risk premium. A well-managed currency exchange rate can keep prices stable and limit inflation because the peg to a basket of currencies curtails expansion of the money supply. Perhaps most importantly, China carefully controls the value of its currency to enhance competitive pricing for its exports. Besides competitiveness, a stable exchange rate can boost trade, support local industries and increase the employment level.
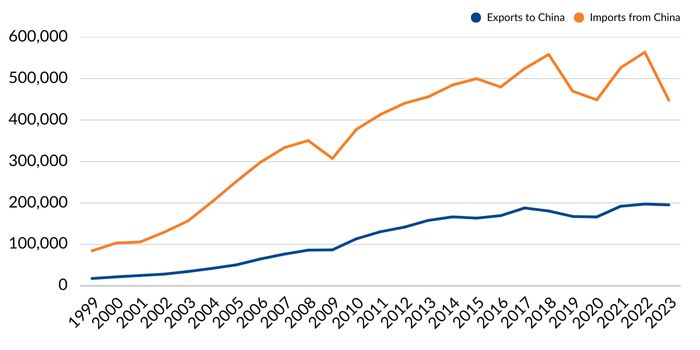
That trade competitiveness puts the renminbi high on President Trump's list of nations with large trade imbalances with the United States. Table 2 and Figure 2 show an increasing gap between exports and imports (discounting the two years following the pandemic) in the new century.
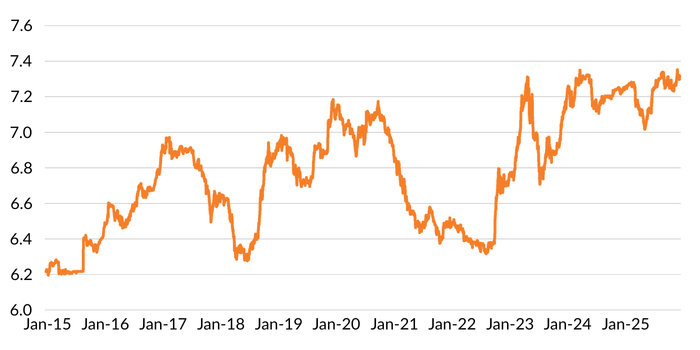
A weaker currency also helps with tariffs. A strengthening dollar/depreciating renminbi since early 2022 (Figure 3) results in a low import price before the US applies tariffs. That means Chinese goods are less expensive in the US than they would be if the renminbi had been strengthening. The United States has become increasingly frustrated with Chinese trade actions, claiming the Asian nation engages in practices that distort markets, hinder fair competition and challenge US economic leadership.
In August 2019, during President Trump's first term, the US labeled China a ‘currency manipulator'. The US claimed China adjusted the dollar – renminbi exchange rate to gain an unfair competitive advantage in trade or to prevent effective balance of payment adjustments. The US Treasury claimed that China had a long history of intervening in the foreign exchange market to support undervalued currency levels. Those currency exchange rates would make Chinese goods cost competitive to domestically produced US goods.
It's this trade competitiveness and negative trade balance that anger President Trump. In February 2025, the president leveled a tariff rate of 10% on imports from China. He then increased the tariff rate to 20% in early March, added another 34% to the rate in early April, raised them to 104% on April 8th and then settled on a tariff rate of 145% on April 9. In late April, the administration said it was considering slashing Chinese import tariffs by, in some cases, more than one-half to de-escalate tensions with the world's second largest economy. There is substantial confusion on actual tariff levels and timing of the cuts.
So, which currency management strategy is best? As western asset managers long accustomed to free floating currency systems, we'd be inclined to give the nod to currencies whose exchange rates change at the whim of supply and demand. But there are plenty of examples of free-floating currency exchange rates that have been manipulated managed, so it's hard to fault China and its managed float.
In the end the management strategy depends on the country's economic structure. Developed economies with broad and deep financial markets gravitate to free floating systems. China deeply wishes the renminbi to be an important global currency, but its capital markets aren't adequate for large foreign investments, and it needs to loosen capital controls. The jump in traded volume of the renminbi from 2019 to 2022 indicates that China is on its way to membership in the free-floating club but isn't there yet.
Connect with us to learn more about Mesirow Currency solutions
Customized solutions to manage unrewarded currency risk in international portfolios.
Strategies that aim to profit from short and medium-term moves in the currency market.
Trading solution for asset managers and owners with focus on reducing transaction costs, improving transparency and enhancing efficiency.
The information contained herein should not be construed as a recommendation to purchase or sell any particular security or investment vehicle offered by Mesirow . The information included has been obtained from sources believed to be reliable, but is not necessarily complete and its accuracy cannot be guaranteed. Any opinions expressed are subject to change without notice. Mesirow Financial Investment Management, Inc. and its affiliated companies and/or individuals may, from time to time, own, have long or short positions in, or options on, or act as a market maker in, any securities discussed herein and may also perform financial advisory or investment banking services for those companies. It should not be assumed that any recommendations incorporated herein will be profitable or will equal past performance. Any stated performance results include the reinvestment of dividends and other earnings. Investment management services offered by Mesirow Financial Investment Management, Inc., an SEC-registered investment advisor.