Insights
Mesirow Small Cap Value: Weathering market downturns
Share this article
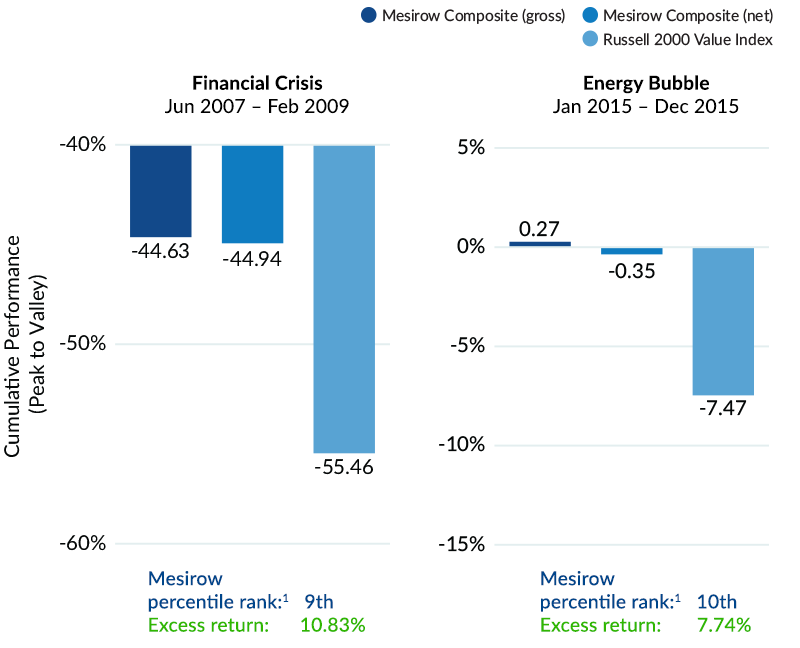
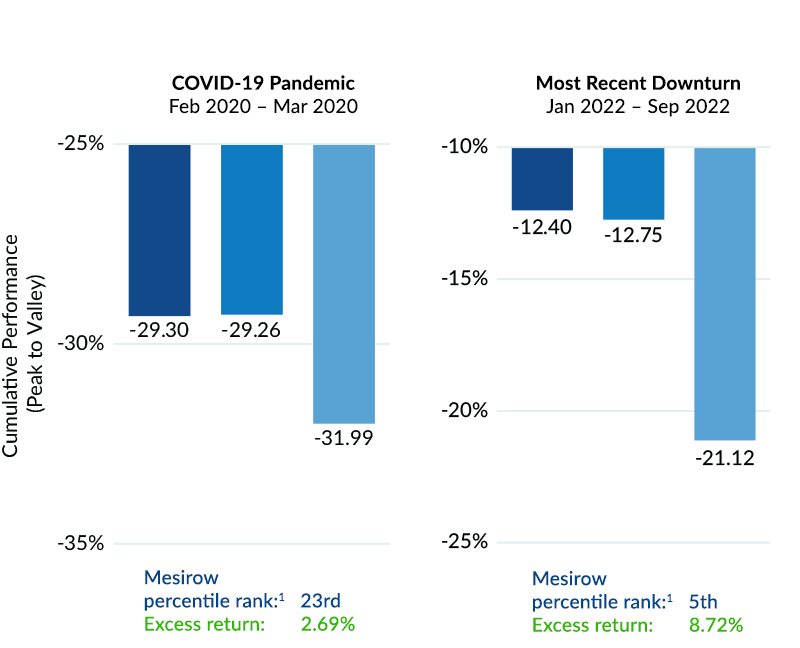
With a focus on risk management, Mesirow Small Cap Value strategy has historically yielded attractive downside protection relative to the Russell 2000 Value Index.1
The strategy has also produced an 83.1% downside capture ratio – from the beginning of the Financial Crisis through the most recent downturn – demonstrating how effective the strategy is in preserving capital in down markets.2
Mesirow Small Cap Value vs. Russell 2000 Value Index
Source: Mesirow Equity Management, Russell and eVestment.
For Institutional use only.
Mesirow Equity Management (“MEM”) is a division of Mesirow Financial Investment Management, Inc., (“MFIM”) an SEC-registered investment manager. Please note that this presentation contains information that is strictly limited to the intended recipients. It is not for use with the general public and may not be distributed.
Past performance is not indicative of future results. Above performance is supplemental. Please review the GIPS Report for complete performance, including net, and benchmark descriptions. Please see below for additional, important information.
Inception date is July 1, 1994.
1. The percentile ranking are based on gross returns and during the "Financial Crisis" time period cited (6/2007–2/2009) included 298 strategies in the U.S. Small Cap Value Equity universe; the ranking during the "Energy Bubble" time period cited (1/2015–12/2015) included 305 strategies in the U.S. Small Cap Value Equity universe; the ranking during the "COVID-19 Pandemic" time period cited (2/2020–3/2020) included 273 strategies in the U.S. Small Cap Value Equity universe; the ranking during the "Current Downturn" time period cited (1/2022–9/2022) included 230 strategies in the U.S. Small Cap Value Equity universe.
2. Downside capture ratio stated is from 1/2004 to 9/2022. Capital preservation is relative to the market (Russell 2000 Value index).
Source: Russell eVestment and Mesirow Equity Management, U.S. Small Cap Value Equity universe. US Equity products that primarily invest in small capitalization stocks that may be trading at prices lower than their fundamental or intrinsic value. Common benchmarks for this universe include the Russell 2000 Value and S&P 600 Value.
Periods over 1 year are annualized. Returns herein are provided on a gross returns basis due to the fact that eVestment collects returns from managers on a gross basis and MEM intends this slide to show an equivalent comparison to other managers. However, the returns herein are not indicative of the actual client returns which will be materially reduced by fees and other expenses. The performance statistics presented are based on the MEM Small Cap Value Equity Composite (“Composite”) against the U.S. Small Cap Value Equity universe. Composite returns are gross of management fees, include the reinvestment of all income and are considered supplemental.
Gross performance shown on this page is not representative of the client's actual return. Client's actual return will be materially reduced by fees and other expenses, as well as the fact that fees and expenses will not be reinvested, which reduces the compounded return.
Spark
Our quarterly email featuring insights on markets, sectors and investing in what matters