TABLE 2: LEAP only backtest, during testing and out-of-saMple periods
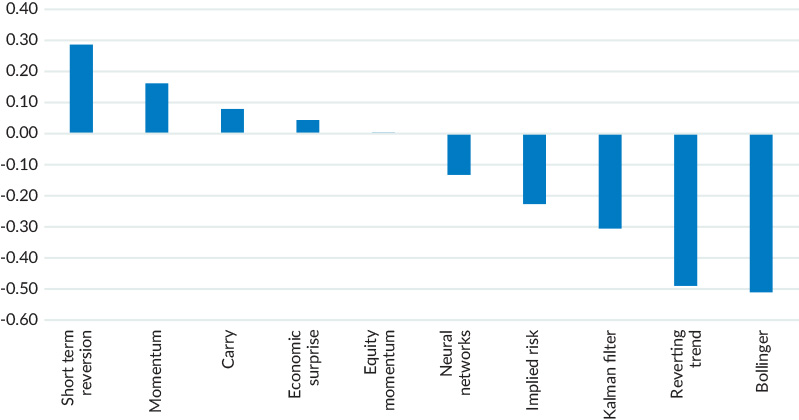
Figure 1: Correlation of LEAP v. other alpha models
Source: Mesirow.

A machine learning-based market regime detection and mean reversion strategy
Mesirow Currency’s Mehryar Emambakhsh, Ph.D. presents Local Extrema Predictor (LEAP), a novel strategy for forecasting mean reversion in foreign exchange (FX) markets.
Mesirow Currency’s Local Extrema Predictor (LEAP), is a technical strategy designed to identify mean reversion in financial time series, with a focus on FX spot rates.


Mean reversion is a financial theory that suggests asset prices and historical returns tend to revert to their long-term average over time. Mean reversion is used for market regime detection and risk sentiment analysis and is driven by a mix of economic, behavioural, and institutional factors.
In foreign exchange (FX) markets, key influential factors include macroeconomic fundamentals, central bank actions, investor sentiment, and geopolitical events. These factors often interact in complex, non-linear ways. This makes MR detection highly context-dependent and computationally difficult.

Implementing machine learning for mean reversion classification and forecasting in FX markets entails three core challenges.
Mesirow Currency proposes a supervised machine learning framework that addresses each of the core issues. Instead of relying on manually defined regimes, the framework derives labels from the trajectory of target spot rates. Specifically, the model assigns each day a label — peak, trough, or neutral — based on local extrema in the time series.
In supervised learning, a labelled dataset is required. However, defining what constitutes a “mean-reverting event” is inherently subjective and lacks a universal standard.
Unlike tasks with clearly defined temporal or spatial signals, MR events do not arise from a fixed set of indicators, making identifying predictive features difficult.
High dimensionality increases the risk of overfitting, particularly when the number of labelled examples is small.
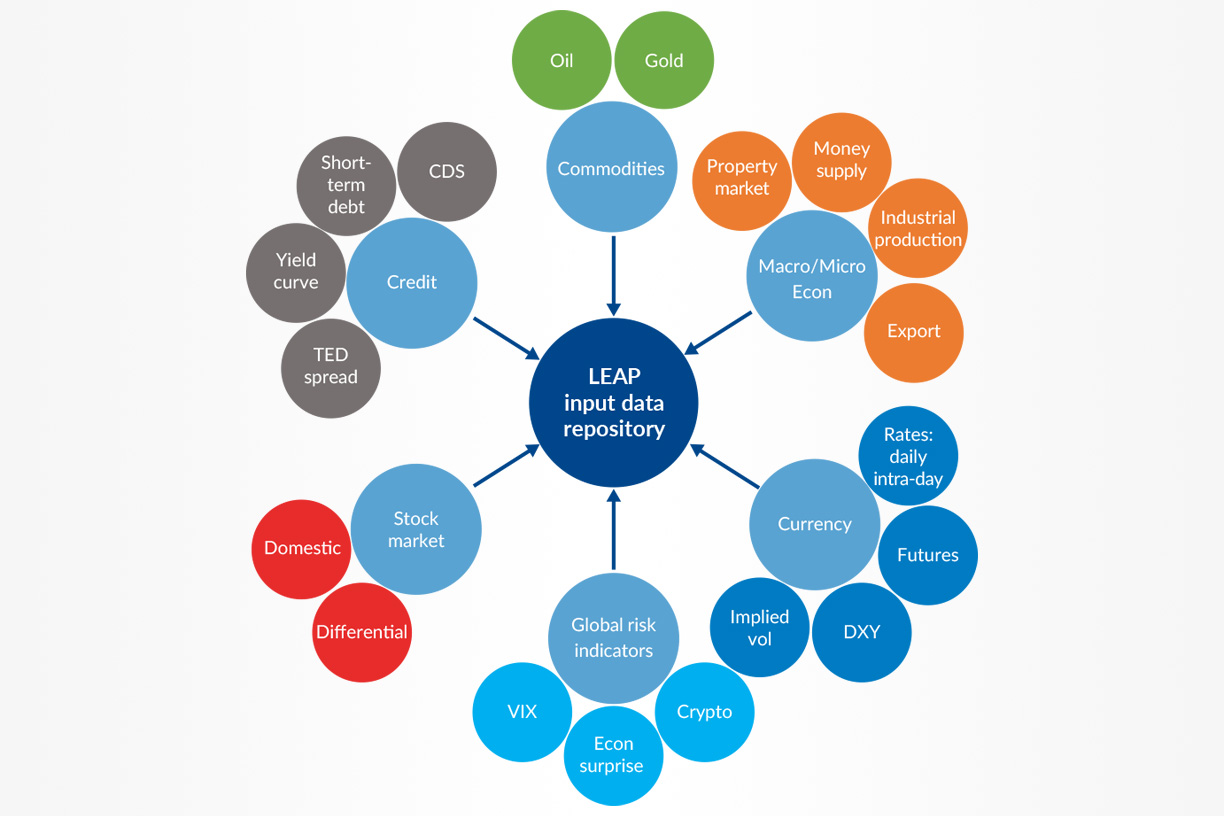
LEAP draws on dozens of FX and non-FX data sources to model mean reversion as a ternary classification problem categorising each point in the target FX series as either
These inputs are transformed into abstract features for our model
Each extremum is assigned a prominence score, borrowing the definition from topography — a measure of how much a peak stands out relative to its surrounding landscape. In our context, prominence quantifies how significantly a peak or trough deviates from recent market movements.
To construct the feature space, a comprehensive software package has been developed, supporting not only feature extraction but also pre- and post-processing of the data. Model training is conducted through rolling k-fold cross-validation, with Support Vector Machines (SVM) hyperparameters optimised via Bayesian techniques. To ensure adaptive learning and reduce dimensionality, a genetic algorithm based feature selection mechanism is employed as a wrapper around the entire pipeline.

A typical LEAP signal at time t for currency pair I. st(i) and pt(i) are the signal and its corresponding confidence, respectively. st(i) denotes the MR signal produced at t for the i-th currency pair. Alongside the signal itself, it is valuable to have an indication of the model’s confidence in its prediction.
When integrated into Mesirow Currency’s Alpha strategies: Extended, Asia, and Emerging, LEAP contributes positively to their overall information ratios. LEAP also demonstrates relatively low correlation with the other technical models within the strategies. Consistent with expectations for a mean reversion strategy, LEAP exhibits negative correlation with trend-following strategies and positive correlation with other mean reversion strategies, such as Mesirow Currency’s Short-Term Reversion and Momentum models.

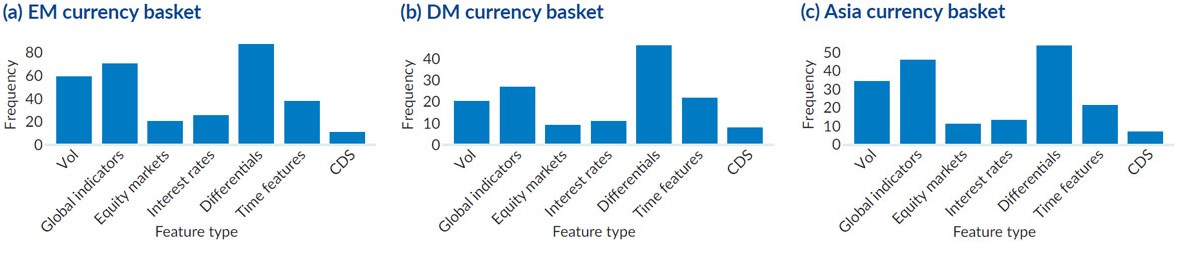
One of the key advantages of using GA for feature selection — compared to dimensionality reduction methods like PCA or LDA — is the explainability of the selected inputs. Excluding indicators based on cross-currency and USD-quoted pairs, input indicators can be grouped into categories. Figure 2 shows the frequency with which each feature category was selected by the GA for the EM, DM, and Asian currency baskets, respectively. Across all three baskets, Differentials and Global indicators emerge as the most frequently selected features. This highlights the importance of geopolitical context and cross-country comparisons in identifying MR in FX.
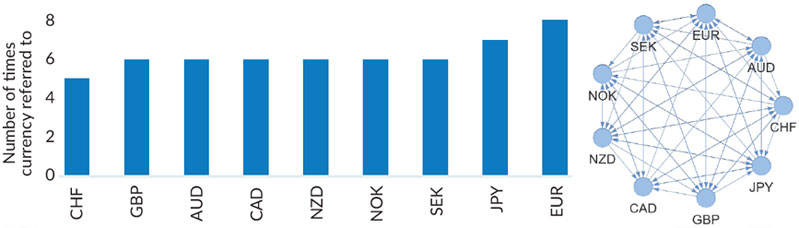
Another important input to LEAP comes from cross-currency pairs calculated for each target currency. For example, when predicting reversions in USDCAD, LEAP also computes all CAD-based crosses against the other 26 currencies in the basket — e.g. CADGBP, CADBRL, CADCHF, CADTWD, and so on. These cross rates are treated as separate feature subsets, and the GA selects the most informative ones. Once this process is completed across all 27 USD-quoted currency pairs, we can visualise and analyse which currencies are most frequently referenced when constructing cross-currency features.
Although LEAP has been evaluated on USD-denominated FX rates, the framework is readily generalisable to other currency crosses and can operate at arbitrary time resolutions. Furthermore, the underlying philosophy of LEAP lends itself well to applications beyond FX, potentially extending to other classes of financial instruments.LEAP has been incorporated into Mesirow Currency’s Alpha suite, deployed in live trading since mid-April 2025.