Insights
2020 Mid-Year Outlook: Paper, Plastics & Packaging
Share this article
Quarter-end review
After a sharp decline in share prices and a collapse in M&A activity in late 1Q2020 / early 2Q2020, the Packaging sector has experienced a recovery with share prices for plastic packaging slightly above those at the beginning of the year. As the Packaging sector overall has performed well during the pandemic, valuations have also recovered and are currently above their past three-year average. M&A activity is expected to be very active in 2021.
M&A activity is gradually picking up and is expected to be quite strong in 2021 for the following reasons:
-
Packaging in general is a primary beneficiary of the impacts resulting from COVID-19
-
Pent-up demand due to lack of M&A transactions in 2020
-
Private equity sponsors have significant equity capital (over $1.7 trillion of “dry powder”) that they need to deploy
-
Strategic buyers looking for acquisitions to obtain growth, scale, diversification and synergies
-
Availability of debt capital at very attractive cost from a historical perspective
Share price performance and public market valuations
Share prices of packaging companies have begun to rebound nicely after their sharp decline following the lock-down in mid-March (Chart 1). These share prices are currently slightly above the levels at the beginning of the year with plastic packaging up 4% on average YTD, though they are down 10% on average YTD for paper packaging.
Chart 1: share price performance: packaging indices
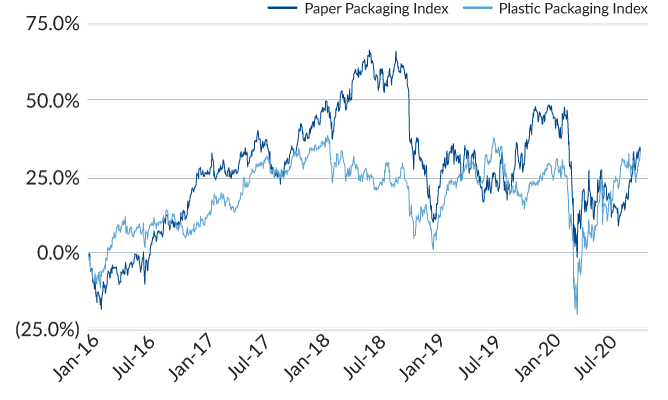
Source: FactSet as of October 8, 2020. Past performance is not indicative of future results.
Consequently, public market valuations for both plastic and paper packaging companies have also recovered. Plastic packaging companies’ valuations are slightly above (1%) their past three year-average, while paper packaging companies’ valuations are up 19% from their past three-year average (Charts 2 and 3).
Chart 2: TEV / EBITDA: Packaging indices
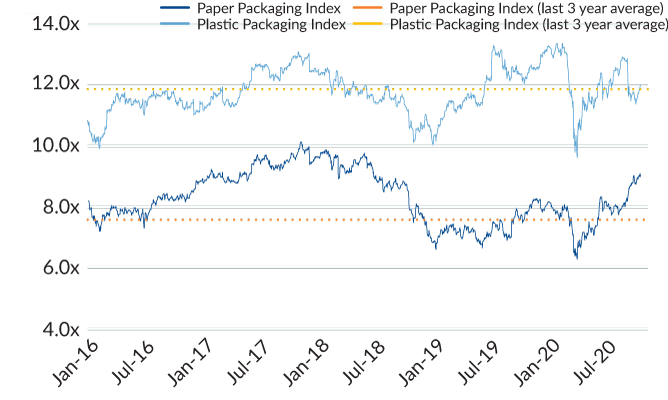
Source: FactSet as of October 8, 2020. Past performance is not indicative of future results.
Chart 3: Public Packaging Company Average TEV / EBITDA Multiples
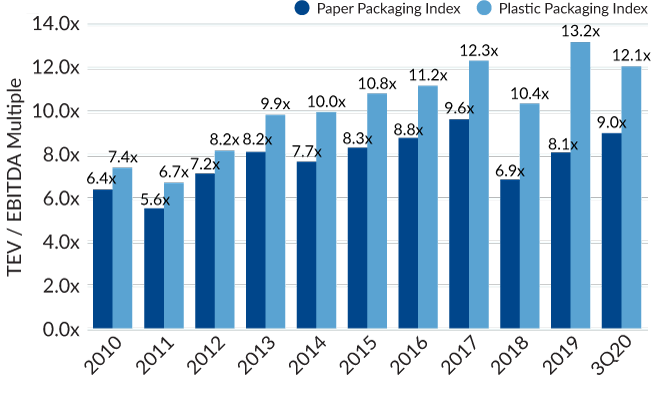
Source: FactSet as of October 8, 2020. Note: Average TEV / EBITDA multiples as of December 31 for 2010-19 and September 30 for 3Q2020.
Spark
Our quarterly email featuring insights on markets, sectors and investing in what matters