The US dollar landed in the lower half of the G10 in Q3, rallying in July and late September after August weakness. The Fed maintained a data-dependent stance throughout the period, keeping rates steady in July before cutting by 25bps in September amid heightened attention on Fed independence and speculation over a potential larger move. Political pressure on Fed independence remained a persistent theme, as President Trump’s nominations and public remarks on monetary policy unsettled markets. Employment softened through the quarter, with non-farm payrolls slowing from 147K in the July release to just 22K in the most recent report. The latest inflation print surprised to the upside at 0.4% MoM.
EUR | Euro was a middling performer in the G10 in Q3 amid mixed economic and political developments. Trade-related uncertainty persisted despite a US-EU deal announced in July. The ECB held rates steady throughout the quarter, with President Lagarde emphasizing data dependence and reiterating that risks to growth remained tilted to the downside. The latest inflation print showed Eurozone CPI at 0.1% MoM and 2.0% YoY. Political uncertainty in France added pressure as Prime Minister Bayrou’s government lost a confidence vote in September, following an earlier challenge in August.
GBP | Sterling was among the weaker G10 currencies in Q3. The BoE cut rates by 25bps in August before holding steady in September in a 7–2 vote, with Governor Bailey noting that the cutting cycle was not yet complete. While labor statistics improved, much of the economic data continued to underwhelm as GDP, manufacturing production, and retail sales all missed expectations earlier in the quarter. The most recent headline CPI print remained elevated at 3.8% YoY while weak PMIs and persistent fiscal concerns weighed on sentiment.
JPY | Japanese yen was a notable underperformer in the G10 in Q3, reflecting political uncertainty and a cautious Bank of Japan. The BoJ kept policy unchanged throughout the period, with Governor Ueda maintaining a wait-and-see stance despite inflation remaining above target earlier in the quarter. Political instability intensified following the ruling coalition’s loss of its upper-house majority, announced in July, and Prime Minister Ishiba’s resignation reported in September. While GDP data released in August printed stronger than expected at 0.3% QoQ, inflation eased to 2.7% YoY in the most recent release.
CAD | Canadian dollar landed in the bottom third of the G10 in Q3. The BoC held rates at 2.75% through July before cutting by 25bps to 2.5% in September, citing risks from global protectionism. Employment data released in August and September were notably weak, showing net job losses of -40.8K and -65.5K, respectively, while unemployment rose to 7.1%. Headline inflation for August registered at 1.9% YoY. Although July’s announcement of higher US tariffs briefly weighed on sentiment, the subsequent removal of retaliatory measures provided limited relief.
AUD | Australian dollar was among the stronger G10 currencies in Q3. The RBA surprised markets in July by holding rates, then delivered a 25bps cut in August, before remaining on hold again in September at 3.6%. Data releases during the quarter were mixed as employment prints were weaker than expected, Q2 GDP beat consensus at 0.6% QoQ, and headline inflation rose to 3.0% YoY in August.
CHF | Swiss franc landed in the middle of the G10 in Q3. The SNB held rates steady at 0% throughout the quarter following 6 consecutive cuts, as inflation remained subdued at 0.2% YoY from the latest release. Swiss manufacturing PMI remained in contractionary territory throughout the quarter. Towards quarter-end, the Swiss Department of Finance and the SNB released a joint statement with the US Treasury reconfirming that both sides will avoid manipulating exchange rates, with a shared view that FX interventions are an appropriate tool for addressing disorderly depreciation or appreciation.
EM | Emerging Market currencies, proxied through the MSCI Emerging Markets Currency Index, fell a modest -0.47% in Q3 as EM equities delivered double-digit returns. The Fed’s September rate cut and ongoing investor enthusiasm for AI-related stocks benefited emerging markets, as Chinese yuan gained against US dollar while Taiwan dollar trailed over the quarter.
| FX Rate | Change 3M % | Change 1Y% | ||
 |
EUR-USD | 1.175 | 0.10% | 5.28% |
 |
GBP-USD | 1.34625 | -1.76% | 0.37% |
 |
USD-JPY | 147.685 | -2.19% | -3.15% |
 |
AUD-USD | 0.66275 | 1.13% | -4.47% |
 |
USD-CAD | 1.3914 | -1.93% | -2.91% |
 |
USD-CHF | 0.79565 | 0.04% | 6.02% |
| Source: WM/Reuters | ||||
Mesirow Currency Management’s (MCM) Extended Markets Currency Alpha, Emerging Markets Currency Alpha and Systematic Macro strategy all made gains this quarter, however, our Asian Markets Currency Alpha strategy ended the quarter in the red.
Our Machine Learning suite of technical models performed the best in 3Q2025, while our trend-following suite of models sustained the greatest losses. Within our Fundamental strategy, the Forward Rate Bias model, which uses prevailing interest rates to rank currencies, performed well every month this quarter.
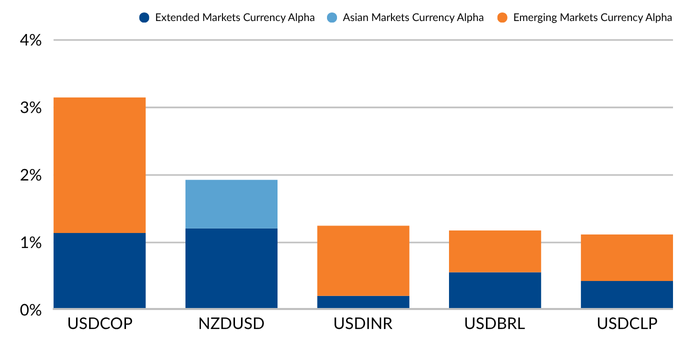
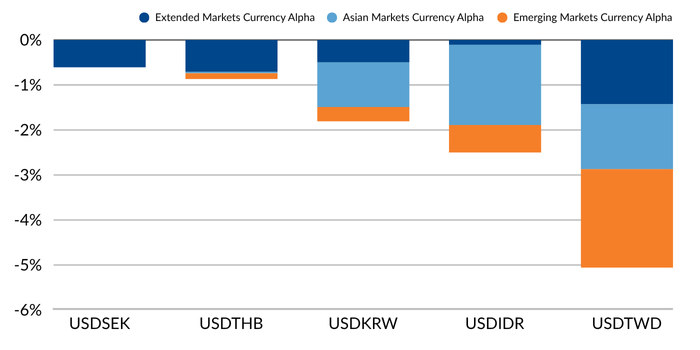
The alpha strategy’s best performers were our short US dollar positions against the New Taiwan dollar, the Czech koruna, and the South Korean won (Figure 4) while our US dollar positions against the Polish zloty, the British pound, and the Australian dollar were our worst performers this quarter (Figure 5).
MCM’s Intelligent Multi-Strategy Currency Factor gave back -0.43% (gross) of value in the third quarter against a backdrop of a mixed, range-bound US dollar. While the Carry factor added meaningful return to the strategy over the quarter against lower interest rate currencies, both Value and Momentum factors returned negative to more than offset Carry in Q3. Swiss franc and Norwegian Krone were the strongest performers, while Sterling and Yen were the main underperformers this quarter.
Connect with us to learn more about Mesirow Currency solutions
Customized solutions to manage unrewarded currency risk in international portfolios.
Strategies that aim to profit from short and medium-term moves in the currency market.
Trading solution for asset managers and owners with focus on reducing transaction costs, improving transparency and enhancing efficiency.
The information contained herein should not be construed as a recommendation to purchase or sell any particular security or investment vehicle offered by Mesirow . The information included has been obtained from sources believed to be reliable, but is not necessarily complete and its accuracy cannot be guaranteed. Any opinions expressed are subject to change without notice. Mesirow Financial Investment Management, Inc. and its affiliated companies and/or individuals may, from time to time, own, have long or short positions in, or options on, or act as a market maker in, any securities discussed herein and may also perform financial advisory or investment banking services for those companies. It should not be assumed that any recommendations incorporated herein will be profitable or will equal past performance. Any stated performance results include the reinvestment of dividends and other earnings. Investment management services offered by Mesirow Financial Investment Management, Inc., an SEC-registered investment advisor.