Insights
Mesirow Currency Management | 1Q2024 Commentary
Share this article
US dollar outperforms all G10 currencies
US dollar outperformed the rest of the G10 in the first quarter of 2024 as other major central banks tilted more dovish than the Fed.
While soft data prints in ISM manufacturing and services and mixed employment data – an upside nonfarm payrolls number was offset by a large revision lower over the prior two months – offered little support, inflation exceeded expectations with the most recent core CPI printing at 0.4% MoM vs. consensus of 0.3%.
The Fed left the current interest rate and the dot plot projection for 2024 unchanged, disappointing hawkish market participants, although the surprise SNB rate cut and disappointing European data positioned other central banks as more dovish relative to the Fed.
FIGURE 1: DXY – 1Q2024
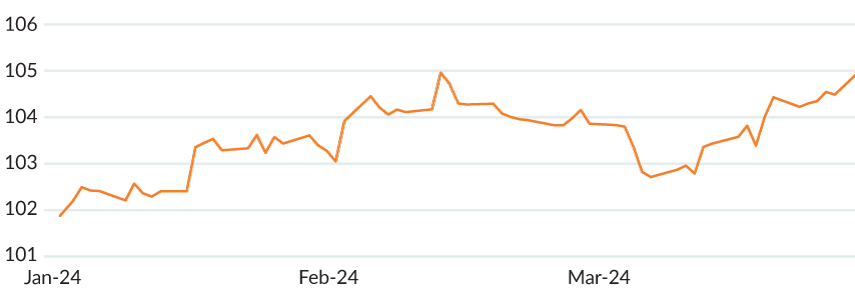
Figure 1 shows a line chart of the US dollar index rising or appreciating between the periods of January 2024 and March 2024. The DXY’s low was 102.2 on January 2 and its high was 104.96, reached on February 13.
Source: Bloomberg
EUR | While finding general strength in Q1 over most developed currencies, Euro trailed both a strong US dollar and a resilient Sterling. While core CPI numbers have been moving lower, printings have surprised higher with the last number coming in at 3.1% YoY vs. 2.9% expected. The ECB kept rates on hold at 4.0% in the March meeting as President Lagarde pushed back against an April cut, although accompanied by dovish forecast revisions in GDP and inflation for 2024. Towards the end of the quarter, Eurozone services PMI rose more than expected while manufacturing PMI fell below expectations.
GBP | Sterling was a strong performer among the G10 in Q2, trailing only the strong US dollar over the quarter. BoE Chief Economist Pill expressed his expectation of inflation falling below the target level of 2% temporarily in the coming months. The latest labor data was dovish, with average weekly earnings surprising lower and unemployment printing above consensus at 3.9% vs. 3.8% expected. However, inflation recently printed softer than expected, with headline CPI at 0.6% MoM vs. 0.7% expected and core at 4.5% YoY vs. 4.6% expected. The BoE left rates unchanged, although with a more dovish split in the MPC voting.
JPY | Yen underperformed the rest of the G10 in Q1, despite a rate hike in March as the BoJ overhauled their monetary policy framework. Spring wage Shunto negotiations saw greater wage growth demands. Labor cash earnings surprised to the upside at 2% YoY. Toyota and other firms agreed to the largest wage hikes in over 25 years. Yen weakness continued with a rapid rise in rates seen as unlikely, prompting an emergency meeting that suggested that authorities were ready to intervene.
AUD | Australian dollar was a middling performer within the G10 over Q1, although performing well in March to end the quarter. The RBA held its cash rate steady at 4.35% but seemed concerned by a very high unit labor cost. However, Governor Bullock described household consumption as particularly weak. Employment change for February surprised higher at 116.5K vs. 40K expected as unemployment dropped to 3.7% from 4.1% the month prior.
CAD | Canadian dollar landed in the upper half of the G10 in Q1, following a particularly strong March. The BoC left rates unchanged at 5% as the Governor indicated that it was too early to consider lowering interest rates. Unemployment printed higher recently at 5.8% although the net change in employment was stronger than expected, registering at 40.7K vs. 20K consensus. The BoC was encouraged by inflation data as the most recent headline CPI printed at 0.3% MoM vs. 0.6% expected.
CHF | Swiss franc performed poorly in Q1, besting only the weaker Yen in G10. The SNB surprised the market by cutting rates by 25bps, the first amongst its peers to lower rates. Inflation continued to tick down, with February registering at 1.2% vs. 1.3% the previous month, well below the 2% target level. The SNB lowered their forecast for consumer prices to 1.5% in 2024, down from 1.9% in its prior forecast.
EM | Emerging market currencies were generally weaker in Q1, as the MSCI EM Currency Index fell close to -1% in a turbulent month, with Mexican and Columbian peso as the rare outperformers against US dollar this quarter. In China, political tension with the US continued as US lawmakers made attempts to discourage investments into China, with further pressure from the Fed’s higher for longer stance.
TABLE 1: USD-BASED AS OF March 31, 2024
| FX Rate | Change 3M % | Change YTD % | ||
| EUR-USD | 1.08 | -2.23% | -0.59% | |
| GBP-USD | 1.26325 | -0.91% | 2.17% | |
| USD-JPY | 151.345 | -6.85% | -12.06% | |
| AUD-USD | 0.6524 | -4.39% | -2.59% | |
| USD-CAD | 1.35325 | -2.56% | 0.01% | |
| USD-CHF | 0.9007 | -6.56% | 1.43% | |
| Source: WM/Reuters | ||||
Currency for return
Currency Alpha
Mesirow Currency Management’s (MCM) Extended Markets Currency Alpha, Asian Markets Currency Alpha, Emerging Markets Currency Alpha and Systematic Macro strategy all suffered losses this quarter.
The Fundamental component of our systematic suite of models performed positively in 1Q2024 across all the strategies, while our Technical models struggled. Our long US dollar positions against the Japanese yen and the Czech koruna delivered gains throughout the quarter, while our short USD position against the Taiwan new dollar created losses amongst the strategies as the dollar gained strength.
Our proprietary measure of global currency volatility, our GVI , fell steadily during the first quarter and reached a low at the end of March (Figure 2). The GVI achieved lows this past quarter not seen since early 2022 (Figure 3), prior to Russia’s invasion of Ukraine.
FIGURE 2: MCM'S GLOBAL VOLATILITY INDICATOR: JANUARY 2024 - March 31, 2024
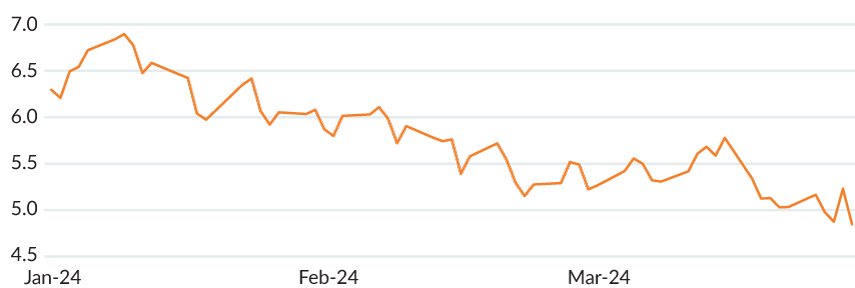
Figure 2 shows a line chart of MCM's Global Volatility Indicator between January 2024 and March 31, 2024. The GVI reaches a high on January 4 (6.89) and reaches a low on March 28 (4.64).
Source: Mesirow
FIGURE 3: MCM'S GLOBAL VOLATILITY INDICATOR: JANUARY 2022 - March 31, 2024
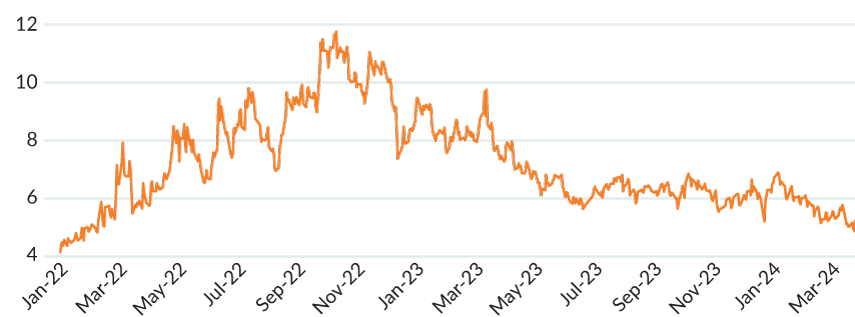
Figure 3 shows a line chart of MCM's Global Volatility Indicator between January 1, 2022 and March 31, 2024. The GVI begins at 4.15 in January of 2022. It rises through 2022 and reaches a high on October 13, 2022 (11.75). The GVI then falls and reaches 4.64 on March 28, 2024.
Source: Mesirow
Intelligent Multi-Strategy Currency Factor
MCM’s Intelligent Multi-Strategy Currency Factor added +1.34% (gross) in Q1 after a slow start in January, followed by strong performance in February and March. Strong US dollar appreciation was captured with long USD positioning, particularly over the last two months of the quarter, most evident against a weak Swiss franc. Carry provided consistently strong positive performance across the quarter. Both Momentum and Value were challenged in January, with Momentum recovering over the next two months while Value held steady after its initial drop to start the year.
Latest MCM viewpoints
Contact us
To learn more about Mesirow Currency Management's custom currency solutions, please contact Joe Hoffman, CEO Currency Management at joseph.hoffman@mesirow.com.
Explore currency solutions
Passive and Dynamic Risk Management
Customized solutions to manage unrewarded currency risk in international portfolios.
Currency for Return
Strategies that aim to profit from short and medium-term moves in the currency market.
Fiduciary FX
Trading solution for asset managers and owners with focus on reducing transaction costs, improving transparency and enhancing efficiency.
1. The GVI is an internal proprietary model utilizing one month at-the-money (ATM) volatility for G10 currencies, including crosses plus BIS liquidity report weightings.
Spark
Our quarterly email featuring insights on markets, sectors and investing in what matters