Insights
2Q2023 Currency Commentary
Share this article
| | |
US dollar finishes middle of pack
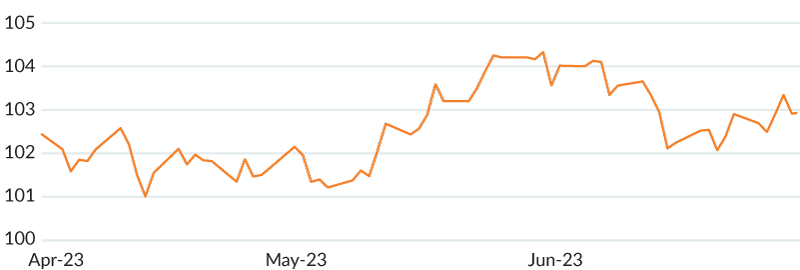
USD snuck into the upper half of the G10 this quarter. While delivering only 25bps of rate hikes over 2Q23, the FOMC dot plot was hawkish in nature, pointing towards two more hikes this year as Chair Powell’s tone at the press conference was more balanced, sticking to the higher-for-longer narrative.
FIGURE 1: DXY – 2Q2023

Source: Bloomberg
EUR | Euro landed in the upper half of the G10, with strong performance against US dollar last month resulting in a relatively stronger quarter. Although economic data surprised to the downside (1Q23 GDP revised downward into a technical recession) and headline inflation decelerated further (flash rate at 5.5% YoY in June), a hawkish ECB supported Euro with two 25bps hikes in 2Q23, bringing rates to 3.5%.
GBP | Sterling was broadly higher, outperforming its G10 peers this quarter. Inflation surprised higher again, with headline CPI at 8.7% YoY vs. 8.4% consensus. The BoE responded by hiking the bank rate by 50bps to 5.0% at its June meeting, following a 25bps hike earlier in the quarter.
JPY | Yen was the worst performer in the G10 this quarter as the BoJ stood pat on rates and continued its YCC program. Although economic growth registered at positive 2.7% in 1Q, BoJ Governor Kazuo stated he did not see the need to change the YCC, dampening any speculation towards interest rate changes.
AUD | Australian dollar was middling, dropping into the lower half of the G10. The RBA surprised the market by hiking 25bps in May and June, raising rates to 4.1%. Unemployment fell a tic to 3.6% in May and employment beat expectations with a 75.9K print, showing a tight labor market.
CAD | Canadian dollar outperformed the G10, save a robust Sterling, with CAD supported by BoC action and strong data. The BoC hiked rates by 25bps in June, up to 4.75%, surprising markets as the central bank justified its stance by stating that monetary policy was not restrictive enough to combat the excess demand in the economy.
CHF | Swiss franc performed well, trailing only Sterling and Canadian dollar in the G10. CHF was supported early on as Parliament approved the Credit Suisse rescue package. While the SNB hiked rates by 25bps in June, many expected a higher increase.
TABLE 1: USD-BASED AS OF JUNE 30, 2023
| FX Rate | Change 3M % | Change YTD % | ||
| EUR-USD | 1.0910 | 0.42% | 2.23% | |
| GBP-USD | 1.2714 | 2.82% | 5.69% | |
| USD-JPY | 144.5350 | -7.92% | -8.71% | |
| AUD-USD | 0.6657 | -0.61% | -1.84% | |
| USD-CAD | 1.3233 | 2.27% | 2.40% | |
| USD-CHF | 0.8947 | 2.11% | 3.41% | |
| Source: WM/Reuters | ||||
Currency for return
Currency Alpha STRATEGIES
Overall, Mesirow Currency Management’s (MCM) Currency for Return strategies had a positive second quarter. Our Emerging Markets Currency Alpha Strategy was, like last quarter, the star performer amongst our alpha strategies. Our Asian Markets Currency Alpha and Systematic Macro strategies also had positive performance, while our Extended Markets Currency Alpha Strategy encountered losses this quarter.
MCM’s alpha strategies perform well in varying market conditions and remain uncorrelated to bonds, stocks, and other market activity (Table 2).
TABLE 2: CORRELATION – STRATEGY INCEPTION TO 2Q20231
| Barclays Aggregate Global Bond Index | HFRX Global Hedge Fund Index | MSCI ACWI Index | S&P 500 Index | Consumer Price Index | |
| Extended Markets Currency Alpha | 0.07 | 0.12 | 0.04 | 0.04 | -0.04 |
| Asian Markets Currency Alpha | -0.10 | -0.08 | -0.18 | -0.17 | 0.06 |
| Emerging Markets Currency Alpha | -0.03 | -0.04 | -0.14 | -0.13 | -0.14 |
| Systematic Macro | -0.07 | 0.10 | -0.06 | 0.00 | -0.05 |
| Source: Mesirow | |||||
Mesirow Currency Management’s (MCM) neural network models (found in the Technical component of the alpha strategies) produced exceptional performance, possibly owing to an increased presence of repeated patterns in market behaviour. With governmental interventions becoming more predictable in this post-pandemic wartime era, financial markets have shown greater stability and discernible trends. This predictability allows the deep neural network models to effectively capture and learn from historical data and enables more accurate predictions and informed decision-making.
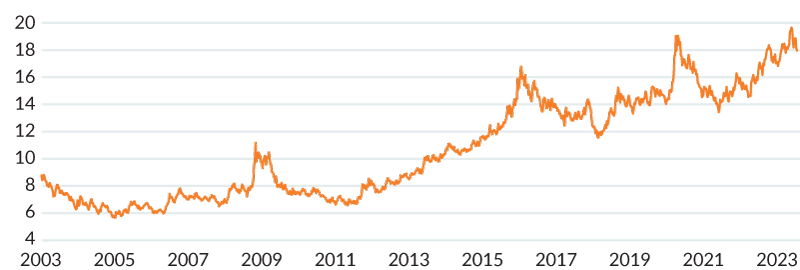
Notably this quarter, the neural network models correctly predicted a USD appreciation against the South African rand (Figure 2), and our long USDZAR position produced excellent returns in our Emerging Markets Currency Alpha Strategy. South Africa’s power crisis, economic instability and rate hikes have led to a depreciating rand, and the currency reached an all-time low in June of 2023 after a US ambassador accused the country of providing aid to Russia.
TABLE 3: USD–ZAR AS OF JUNE 30, 2023
| FX Rate | Change 3M % | Change YTD % | ||
| USD-ZAR | 18.8913 | -6.08% | -9.93% | |
| Source: WM/Reuters | ||||
FIGURE 2: USD–ZAR | JANUARY 1, 2003 – JUNE 30, 2023

Source: Bloomberg
Intelligent Multi-Strategy Currency Factor STRATEGY
MCM’s Intelligent Multi-Strategy Currency Factor recorded a positive quarter on the back of a strong June, as short positions against a weaker US dollar prevailed. The Carry factor was the main contributor to outperformance over the quarter, along with additional added value from the Momentum factor partially offset by the underperforming Value factor.
Latest Mesirow Currency viewpoints
-
Turkey struggles to prevent currency crisis, but the lira continues to plummet.
-
T+1 security settlements. Is the FX market ready?
-
Nations are launching digital currencies. Will the US be a leader or a laggard in the CBDC race?
Contact us
To learn more about Mesirow's custom currency solutions, please contact Joe Hoffman, CEO Currency Management at joseph.hoffman@mesirow.com.
Explore currency solutions
Passive and Dynamic Risk Management
Customized solutions to manage unrewarded currency risk in international portfolios.
Currency for Return
Strategies that aim to profit from short and medium-term moves in the currency market.
Fiduciary FX
Trading solution for asset managers and owners with focus on reducing transaction costs, improving transparency and enhancing efficiency.
1. Source: Mesirow, Bloomberg, U.S. Bureau of Labor Statistics. The above performance information is supplemental. Performance of the Extended Markets Currency Alpha Strategy, Asian Markets Currency Alpha Strategy, Emerging Markets Currency Alpha Strategy, and the Systematic Macro Strategy prior to 10.1.18, was attained at The Cambridge Strategy (TCS), an unaffiliated investment manager. On 10.1.18, a MFIM affiliate completed the purchase of a significant portion of TCS’ assets, including TCS’ intellectual property and hired a majority of TCS employees. Past performance is not an indication of future results. Actual results may be materially different from the results achieved historically. Notes on performance: The Extended Markets Currency Alpha Strategy (Extended Alpha Strategy) commenced trading in 4.1.04. The Asian Markets Currency Alpha Strategy (Asian Alpha Strategy) commenced trading in 2.1.06. The Emerging Markets Currency Alpha Strategy (EM Alpha Strategy) commenced trading in 2.1.08. Systematic Macro Performance includes performance 1.1.12 - present. Performance 1.1.12 to 2.1.18 represents hypothetical trading with backfilled data and does not represent trading on behalf of an actual client account. See the disclosure slide at the end of this presentation for information regarding hypothetical performance results. The returns for 2.1.18 are unadjusted returns for a partial month. The strategies illustrated above include accounts containing both client and Firm capital. To the extent that any account contained both client and Firm capital, assets in such account were traded in an identical manner and thus the client and Firm have identical gross returns. The MSCI ACWI Index is a free float-adjusted market capitalization weighted index that is designed to measure the equity market performance of developed and emerging markets. The MSCI ACWI consists of 46 country indices comprising 23 developed and 23 emerging market country indices. The HFRX Global Hedge Fund Index is comprised of all eligible hedge fund strategies; including but not limited to convertible arbitrage, distressed securities, equity hedge, equity market neutral, event driven, macro, merger arbitrage, and relative value arbitrage. The strategies are asset weighted based on the distribution of assets in the hedge fund industry. The Bloomberg Barclays Global Aggregate Bond Index is a flagship measure of global investment grade debt from twenty-four local currency markets. This multi-currency benchmark includes treasury, government-related, corporate and securitized fixed-rate bonds from both developed and emerging markets issuers. The S&P 500, or simply the S&P, is a stock market index that measures the stock performance of 500 large companies listed on stock exchanges in the United States.
Spark
Our quarterly email featuring insights on markets, sectors and investing in what matters
