US dollar underperformed the rest of the G10 in the second quarter. Uncertainty surrounding trade policy spiked as "Liberation Day" spooked the markets, although the tariff follow-through has been littered with pauses and rhetoric. As the Fed remained patient on rates, further uncertainty was injected into the markets from Trump repeatedly commenting on replacing Fed Chair Powell, threatening Fed independence. Moody's credit downgrade and the potential consequences of the big, beautiful bill also weighed on USD. While geopolitical tensions in the Middle East allowed for safe-haven tendencies to re-emerge at times, US dollar ended the quarter much lower than its peers.
EUR | Euro outperformed all but Swiss franc in the G10 in Q2, acting as a more consistent USD alternative amid trade uncertainty. While the ECB dropped rates to 2% to mark the 8th cut during this easing cycle, President Lagarde provided relatively hawkish commentary signaling a pause in the cycle with inflation beginning to settle. Flash inflation in early June indicated headline CPI at 1.9% YoY in May, below the ECB target of 2%. A weaker US dollar buoyed EURUSD, broadly supporting Euro throughout the month.
GBP | Sterling landed in the middle of the G10 in Q2. The UK managed to avoid the worst of Trump's threats by securing a trade deal and temporarily avoiding Trump's executive order to double steel tariffs to 50%. The BoE cut rates in May, followed by a hold in June by a 6-3 vote. Following stronger than expected numbers early in the quarter, GDP data prints in June disappointed, printing at -0.3% MoM vs. -0.1% expected, along with weaker labor data as unemployment for April moved up to 4.6% and payrolls dropped by -109K vs. -20K expected. The latest headline CPI printed stronger than expected at 3.4% YoY vs. 3.3% expected.
JPY | Yen underperformed most of the G10 in Q2, besting only the weak US dollar. Any safe-haven support from global trade uncertainty and from Mideast tensions was short-lived as JPY came under pressure. The BoJ kept rates unchanged while indicating a reduction in monthly bond purchases to quarterly starting next fiscal year. The IMF stated that the BoJ was likely to push back the timing of interest rates hikes due to tariff uncertainty, while also cutting its 2025 Japanese growth forecast to 0.6%. Trump ended the quarter suggesting that there would not be a trade deal with Japan.
CAD | Canadian dollar landed in the middle of the G10 in Q2. Following the cut in March, the BoC held rates in check amid US tariff uncertainty, with Governor Macklem reiterating that inflation has been running hotter than expected. Unemployment ticked higher to 7.0% while inflation for May for both core and headline printed as expected at 3.0% and 1.7% YoY, respectively. Trade tensions with the US flared over Canada's planned digital service tax on the US, which was eventually withdrawn as Trump threatened to end trade talks.
AUD | Australian dollar landed in the bottom half of the G10 in Q2. In May, the RBA cut rates by 25bps with RBA Governor Bullock stating that the board had considered a 50bp cut with negative revisions to growth forecasts. De-escalations in US-China trade tensions, as well as an Israel-Iran cease fire, boosted risk sentiment and helped support AUD in June. While Q1 GDP printed lower than expected at 0.2% QoQ vs. 0.4% consensus, headline inflation for May registered at 2.1% YoY vs. 2.3% expected.
CHF | Swiss franc outperformed the rest of the G10 in Q2, as geopolitical tensions in the Mideast helped propel CHF higher in a flight to safety. May headline CPI came in negative at -0.1% YoY while core dropped to 0.5% YoY. The SNB cut rates by 25bps down to 0.0%, with President Schlegel hinting at a move towards negative rates while acknowledging its undesirable consequences while keeping FX intervention on the table.
EM | Emerging market currencies gained over 5% in Q2, as represented by the MSCI Emerging Markets Currency Index, with continuing US dollar weakness promoting higher EM currencies. In China, a decrease in trade tension helped lift the CSI equity index and showed a willingness to allow their currency to strengthen. In Mexico, MXN leveraged strong Mexican equity performance and confidence in President Sheinbaum's ability to handle Trump.
| FX Rate | Change 3M % | Change 1Y% | ||
 |
EUR-USD | 1.17385 | 8.67% | 9.53% |
 |
GBP-USD | 1.37035 | 6.17% | 8.41% |
 |
USD-JPY | 144.445 | 3.53% | 11.36% |
 |
AUD-USD | 0.65535 | 5.17% | -1.87% |
 |
USD-CAD | 1.3645 | 5.48% | 0.28% |
 |
USD-CHF | 0.796 | 11.15% | 12.89% |
| Source: WM/Reuters | ||||
Mesirow Currency Management's (MCM) Extended Markets Currency Alpha, Asian Markets Currency Alpha, Emerging Markets Currency Alpha and Systematic Macro strategy all made gains this quarter.
Our Machine Learning, Trend-following, and Non-Correlated suites of models all performed positively in 2Q2025.
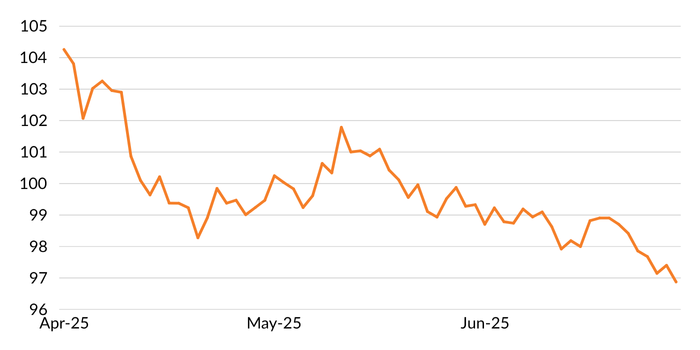
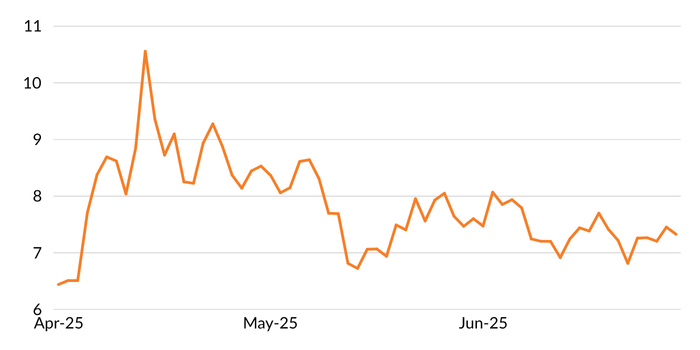
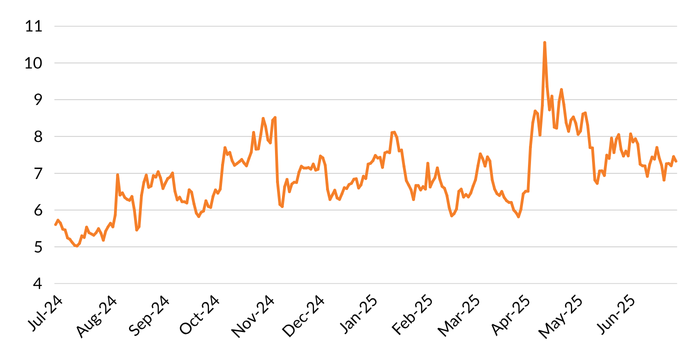
Global volatility spiked mid-April (Figure 2 and Figure 3) but ended the quarter at levels we've been seeing for roughly a year.
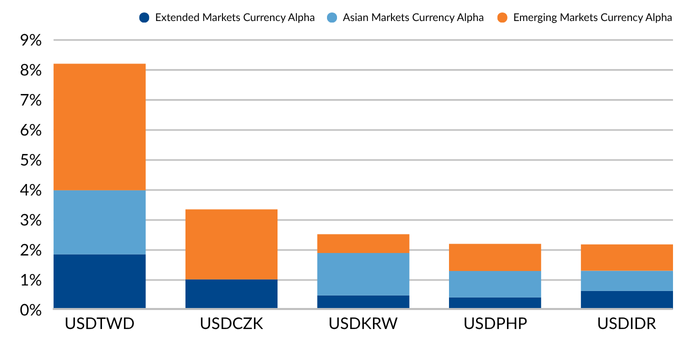
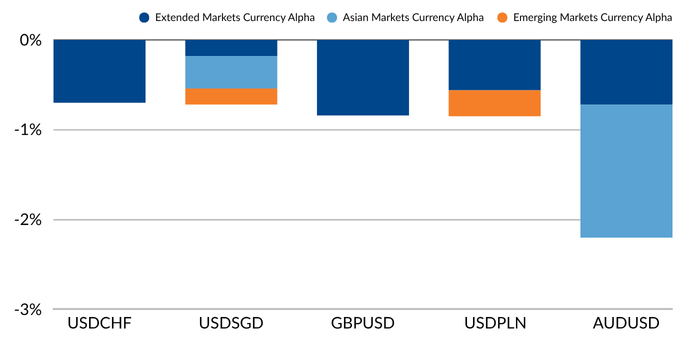
The alpha strategy's best performers were our short US dollar positions against the New Taiwan dollar, the Czech koruna, and the South Korean won (Figure 4) while our US dollar positions against the Polish zloty, the British pound, and the Australian dollar were our worst performers this quarter (Figure 5).
MCM's Intelligent Multi-Strategy Currency Factor gave back -0.12% (gross) of value in the second quarter against a backdrop of continued US dollar weakness. Productive positioning in Euro, Sterling, and Canadian dollar were more than offset from short CHF positioning, as safe-haven flows drove Swiss franc higher, going against the portfolio. While Momentum was particularly strong over the quarter, Carry and Value were both detractors, netting to modest underperformance in Q2.
Connect with us to learn more about Mesirow Currency solutions
Customized solutions to manage unrewarded currency risk in international portfolios.
Strategies that aim to profit from short and medium-term moves in the currency market.
Trading solution for asset managers and owners with focus on reducing transaction costs, improving transparency and enhancing efficiency.
The information contained herein should not be construed as a recommendation to purchase or sell any particular security or investment vehicle offered by Mesirow . The information included has been obtained from sources believed to be reliable, but is not necessarily complete and its accuracy cannot be guaranteed. Any opinions expressed are subject to change without notice. Mesirow Financial Investment Management, Inc. and its affiliated companies and/or individuals may, from time to time, own, have long or short positions in, or options on, or act as a market maker in, any securities discussed herein and may also perform financial advisory or investment banking services for those companies. It should not be assumed that any recommendations incorporated herein will be profitable or will equal past performance. Any stated performance results include the reinvestment of dividends and other earnings. Investment management services offered by Mesirow Financial Investment Management, Inc., an SEC-registered investment advisor.