- Strategy commenced trading February 2018
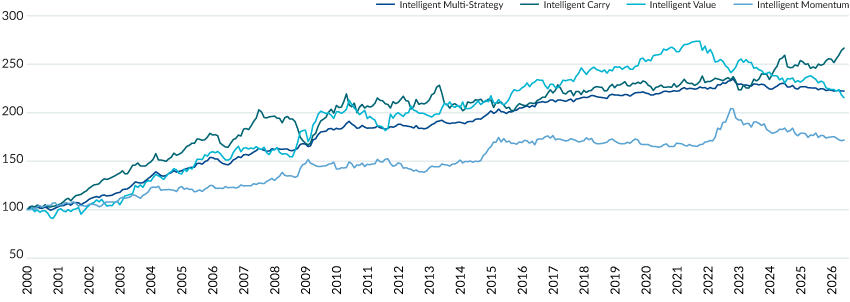
- Invests in the systematic components of MCM’s three alpha programmes: Asia, Emerging and Extended
- Portfolios constructed by allocating capital to the systematic components of our three alpha programmes
- Equal risk contribution approach
Performance Data (%) |
May 2026
Source: Mesirow. | Please see PDF below for more performance statistics.
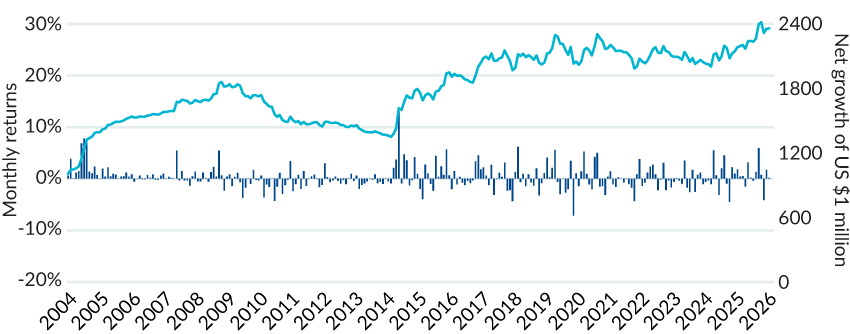
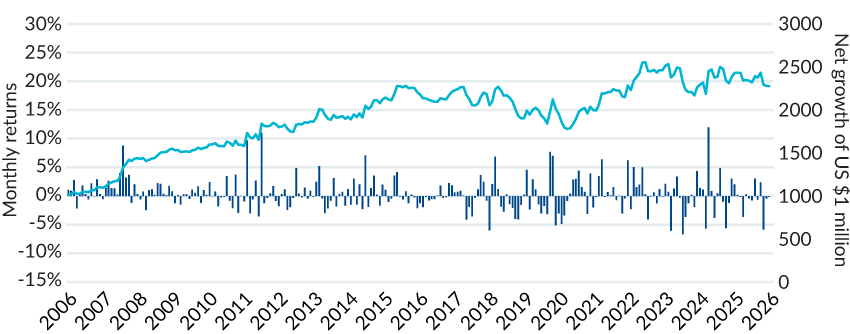
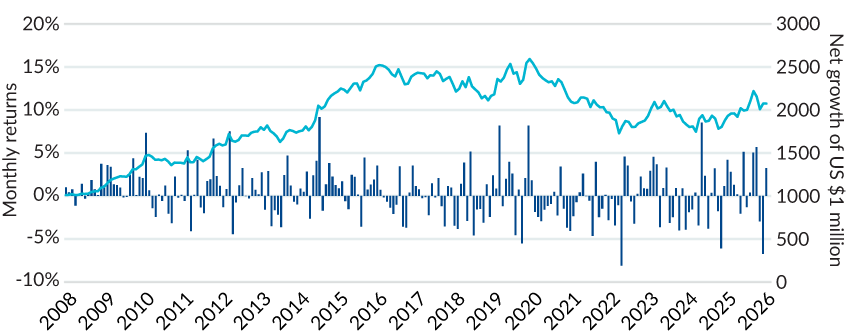
Net monthly and cumulative performance
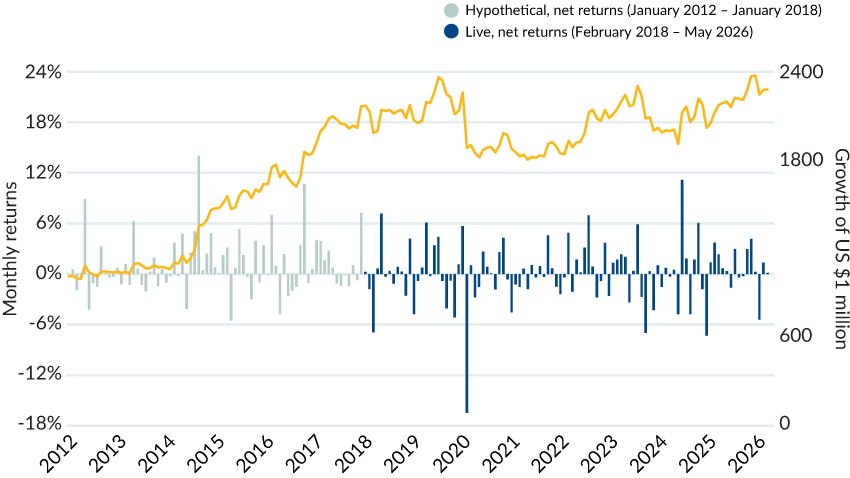
Source: Mesirow.
Performance of the Sysetmatic Macro Strategy prior to October 1, 2018 was attained at The Cambridge Strategy, an unaffiliated investment manager. On October 1, 2018, a MFIM affiliate completed the purchase of a significant portion of TCS’ assets, including TCS’ intellectual property and hired a majority of TCS employees. Past performance is not an indication of future results. Actual results may be materially different from the results achieved historically. Please refer to the disclaimer at the end of these materials for important additional information. | 5. Performance prior to February 2018 represents simulated trading with backfilled data and does not represent trading on behalf of an actual client account. The returns for February 2018 are unadjusted returns for a partial month. Performance of the Systematic Macro Strategy prior to October 1, 2018, was attained at The Cambridge Strategy (TCS), an unaffiliated investment manager. On October 1, 2018, a MFIM affiliate completed the purchase of a significant portion of TCS’ assets, including TCS’ intellectual property and hired a majority of TCS employees. Past performance is not an indication of future results. Actual results may be materially different from the results achieved historically. | Notes on performance: The Systematic Macro Multi-Strategy commenced trading in February 2018 and combines the systematic carve-outs from the Emerging, Asian and Extended Market Macro Strategies. These three carve-out components are combined into a single set of portfolio returns using an equal-risk allocation procedure based on a proprietary method of measuring each component’s portfolio risk contribution. Leverage is then used to target an overall portfolio volatility of 12% per annum. The allocation weights are simulated from January 2012 to January 2018. Fees are based on a client’s volatility level, which can be customized to their preference. Net returns are calculated using implied management fees of 0.75% per annum and performance fees of 10% per annum, which are the highest fee level based on the highest volatility level. Performance fees are accrued daily, paid quarterly and a high water mark is employed. Performance is in USD and all returns and statistics are based on monthly returns. The composite includes all fee paying accounts, including both commingled and managed accounts. Currency trading may involve instruments that have volatile prices, are illiquid or create economic leverage. Emerging markets securities involve risks such as currency fluctuation and political and economic instability that could result in additional volatility. Unhedged short sales expose the strategy to additional liability.