The US dollar finished in the upper third of the G10 in Q1, reflecting a shift from early-quarter weakness to a sharp risk-off rally in March. In January, the dollar weakened on geopolitical and policy uncertainty stemming from Fed independence concerns, tariff tensions, and FX intervention speculation, before a modest late-month rebound following the nomination of anew Fed Chair.
In February, US dollar strengthened against most developed peers, supported by stronger labor and inflation data, hawkish FOMC minutes, and rising geopolitical tensions. In March, escalating Middle East conflict and surging oil prices drove safe-haven demand, with the Fed remaining on hold and macro data taking a secondary role, while intermittent de-escalation headlines contributed to elevated volatility.
Overall, US dollar strength was underpinned by sustained risk aversion and a repricing of rate expectations for the quarter.
EUR | Euro landed in the lower third of the G10 in Q1, pressured by external factors and limited domestic catalysts. In January, Euro underperformed most G10 peers despite benefiting from broad US dollar weakness, as softer services activity and weaker confidence weighed on sentiment. February saw continued range-bound trading amid steady ECB policy and cooling core inflation, with geopolitical and trade uncertainty constraining upside. In March, Euro came under sustained pressure from US dollar strength and energy-related risks stemming from Middle East tensions, while mixed activity data and a more cautious ECB tone provided limited support. Overall, external drivers dominated, with policy credibility offering only partial insulation for the quarter.
GBP | Sterling weakened against most of the G10 in Q1, reflecting a mix of domestic softness and external headwinds. January saw mixed data, with firmer inflation and retail sales offset by weaker labor market dynamics and soft PMIs. In February, Sterling underperformed sharply amid political uncertainty and a dovish-leaning BoE stance despite sticky inflation. March continued to weigh on Sterling, as disappointing growth data and heightened sensitivity to rising oil prices compounded pressure from global risk-off sentiment. While resilient labor data and a more cautious BoE provided intermittent support, Sterling remained vulnerable to both domestic fragility and external shocks.
JPY | Yen was a middling performer in Q1, driven by persistent policy divergence and heightened political uncertainty. January and February were characterized by fiscal concerns, accommodative monetary policy expectations, and limited impact from intervention rhetoric. In March, Yen weakened further despite occasional support from intervention threats, as global risk-off dynamics favored US dollar over traditional safe-havens. While the BoJ maintained a steady stance and left room for future tightening, rising oil prices and weak domestic drivers kept the currency under pressure.
CAD | Canadian dollar landed n the lower half of the G10 in Q1, balancing domestic softness with support from energy markets. January and February saw Canadian dollar weighed down by weaker labor data, softer inflation, and trade policy uncertainty, despite stable central bank policy and GDP resilience. In March, although surging oil prices provided a supportive backdrop, Canadian dollar gains were limited by risk-off sentiment and US dollar strength, with domestic data playing a secondary role to external drivers.
AUD | Australian dollar was one of the top performers in the G10 in Q1, supported by a hawkish policy backdrop and resilient domestic data. January and February saw Australian dollar benefit from risk-on sentiment, strong labor market outcomes, and an RBA rate hike alongside upgraded growth expectations. In March, Australian dollar came under pressure from broad US dollar strength and deteriorating global risk sentiment, although hawkish RBA communication and prior momentum helped cushion declines, with AUD outperformance earlier in the quarter offsetting late-quarter weakness.
CHF | Swiss franc finished in the upper half of the G10 in Q1, supported by its defensive characteristics despite some volatility. In January and February, Swiss franc benefited from safe-haven demand amid global uncertainty and US dollar fluctuations, along with solid inflation and labor market prints. However, in March, Swiss franc underperformed US dollar as safe-haven flows favored USD. The SNB maintained an accommodative stance while signaling willingness to intervene, with rising oil prices and inflation expectations complicating the currency’s traditional role as a safe-haven.
EM | Emerging Market currencies, proxied through the MSCI Emerging Markets Currency Index, appreciated 0.52% over the quarter as EM equities continued to climb into year-end, and Fed rate cuts helped support higher carry EM currencies. Regionally, the PBOC continued to guide USDCNY fixings lower over the quarter as talks between Trump and Xi focused on more trade cooperation, as Yuan gained against US Dollar.
| FX Rate | Change 3M % | Change 1Y% | ||
 |
EUR-USD | 1.1522 | -0.89% | 6.67% |
 |
GBP-USD | 1.3187 | -1.96% | 2.17% |
 |
USD-JPY | 159.09 | -1.47% | -6.00% |
 |
AUD-USD | 0.6849 | 2.71% | 9.91% |
 |
USD-CAD | 1.39555 | -1.78% | 3.13% |
 |
USD-CHF | 0.80355 | -1.41% | 10.11% |
| Source: WM/Reuters | ||||
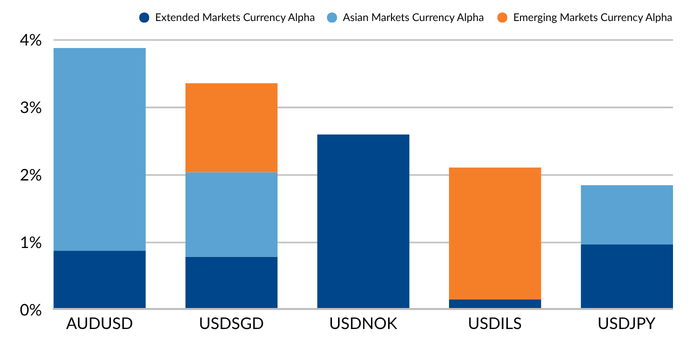
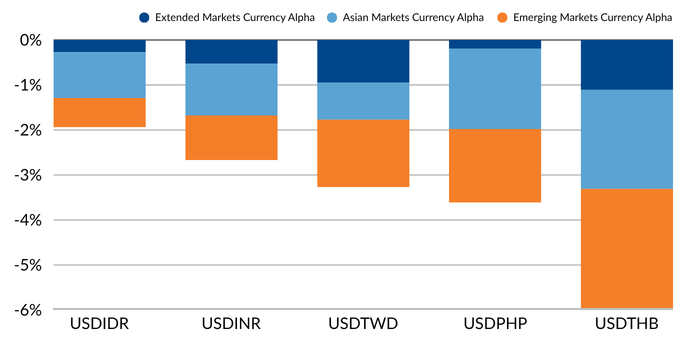
Mesirow Currency’s Extended Markets Currency Alpha strategy made gains this quarter, while our Asian Markets Currency Alpha, Emerging Markets Currency Alpha and Systematic Macro strategies suffered losses. Our Machine Learning and Mean Reverting groups of technical models performed the best during 1Q2026, helping mitigate losses from our Non-Correlated models.
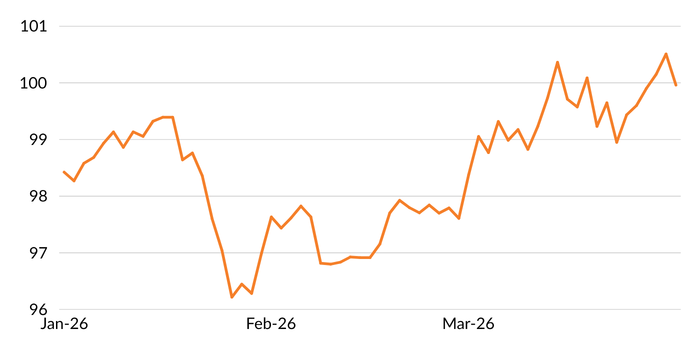
Our proprietary Global Volatility Indicator (GVI) peaked at the end of January, fell during the month of February, then rose again during the month of March (Figure 2).
The alpha strategy’s best performers were our short US dollar positions against the Singapore dollar and the Norwegian krone and a long Australian dollar position v. USD (Figure 4).
Mesirow Currency’s Intelligent Currency Factor strategy was modestly negative over the first quarter, returning -0.03% (gross), as early-quarter US dollar weakness reversed amid rising geopolitical uncertainty into quarter-end. Carry remained a positive contributor, but this was fully offset by negative Momentum, leaving Value as the primary source of the portfolio’s slight detraction. Swiss franc positioning contributed most to performance, supported by both Carry and Value, while Euro was the largest detractor, with both Value and Momentum weighing on returns. Overall, these offsetting effects resulted in a modestly weaker quarter.
Connect with us to learn more about Mesirow Currency solutions
Customized solutions to manage unrewarded currency risk in international portfolios.
Strategies that aim to profit from short and medium-term moves in the currency market.
Trading solution for asset managers and owners with focus on reducing transaction costs, improving transparency and enhancing efficiency.
The information contained herein should not be construed as a recommendation to purchase or sell any particular security or investment vehicle offered by Mesirow . The information included has been obtained from sources believed to be reliable, but is not necessarily complete and its accuracy cannot be guaranteed. Any opinions expressed are subject to change without notice. Mesirow Financial Investment Management, Inc. and its affiliated companies and/or individuals may, from time to time, own, have long or short positions in, or options on, or act as a market maker in, any securities discussed herein and may also perform financial advisory or investment banking services for those companies. It should not be assumed that any recommendations incorporated herein will be profitable or will equal past performance. Any stated performance results include the reinvestment of dividends and other earnings. Investment management services offered by Mesirow Financial Investment Management, Inc., an SEC-registered investment advisor.