
FX‑hedged investment funds are widely used by Swiss institutional investors seeking to neutralize currency risk on foreign assets. By investing in hedged share classes, investors effectively delegate currency risk management to fund issuers, making both the cost and quality of hedge implementation critical.
This article examines the FX hedging performance of funds offering both hedged and unhedged share classes, isolating total FX hedging costs by comparing their performance differential to that of Mesirow Currency, a specialized currency overlay manager. This approach captures not only explicitly reported fees, but also implicit costs arising from hedge execution, roll mechanics, and transaction frictions.
Using a broad sample of USD‑denominated funds observed over the 2011–2023 period, we show that FX‑hedged share classes have consistently underperformed an independently managed currency hedge by more than 15 basis points per year, reflecting structural inefficiencies that are negatively affected by certain market conditions.
Our focus centers on funds invested in USD-denominated assets.1 The reason for this choice is twofold. First, US assets dominate the foreign exposures of Swiss investors. Second, having a single currency exposure greatly enhances the precision of the analysis as we do not have to estimate time-varying weights across several regions and their respective currencies.
We originally conducted this study in 2019, and this article provides an update to that work. Our samples are, therefore, split into two periods: January 2011 to December 2018 (our first study) and January 2019 to August 2023.
Data has been self-reported by fund issuers and each fund contains both a hedged share class and an unhedged share class.
Putting implicit costs aside for now, a natural starting point is to examine explicit FX hedging costs.
Comparing the Total Expense Ratio (TER) of the hedged and unhedged share class reveals whether the fund charges additional fees for FX hedging and, if yes, how much. The resulting statistics are presented in Table 1 for both periods.
Although the average and lowest FX hedging fees stayed stable between the two periods, the median and percentage of funds charging higher fees for their hedged share class increased. This is quite surprising given the prevailing trend in the investment industry for ever lower management fees.
An event that could be the cause of this discrepancy is the implementation of the European MiFID II regulation in 2018 which, among other things, requires funds to publish a broader set of total costs borne by investors. Nevertheless, the highest hedging fee at 14 basis points (up from 12) remains astonishing.
But even the average hedging fee, at 4 basis points, is inexplicably high given that a specialized currency overlay manager would typically charge around 1-2 basis points to implement this type of (passive) currency hedging.
Investors now recognize that explicit fees are only one aspect of the total costs dragging on their returns. In our context, the implementation of the hedges, from process to transaction execution quality, incur costs that can only be unveiled by comparing bottom line performances, which is what we turn to now.
For each fund and year, we subtract the performance of the hedged share class from that of the unhedged one. This allows us to isolate the (total) FX hedging component given that both share classes are identical in their investments except for the FX hedge.2
The FX hedging component is then compared to the one implemented by Mesirow Currency on representative client accounts. We present our results for the most recent sample in the histogram below, where each observation is the FX hedging under- or over-performance of a fund over Mesirow Currency for a given year.
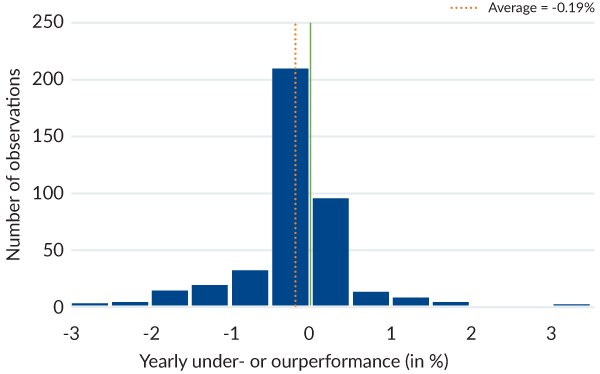
The distribution, as represented by the blue rectangles, shows a negative skew, meaning that it is rather concentrated to the left of the green line delimiting negative and positive values. This implies that funds tended to under-perform Mesirow Currency in terms of currency hedging.
More precisely, this occurred 70% of the time and resulted in an average yearly under-performance of -0.19% over the years 2019-2023.
Recall our discussion of explicit hedging costs where a minority of funds (41%) charged additional fees for the FX hedging service with an average of 0.04% per year. Our analysis of total costs (i.e. both explicit and implicit) shows that 70% of the time funds underperform (-0.19% on average) Mesirow Currency and the average cost is almost five times worse.3 Importantly, these total costs can only be exposed by having access to an appropriate benchmark, in this case the performance of a specialized currency manager.
In our previous paper (the earlier sample 2011-2018), we discovered the funds underperform (-0.15% on average) Mesirow Currency 79% of the time. If anything, funds reduced their probability of underperforming slightly over time, but when they did, their underperformance was worse.
Coming back to our most recent sample, we turn our attention to fund characteristics to investigate whether they influence FX hedging underperformance. In addition to the Total Expense Ratio (TER), we focus on fund size (in terms of assets under management – split evenly between large and small4) and management style (active – where the goal is to beat a reference index – or passive – where the goal is to replicate a reference index).
For each group, we measure how the average annual FX hedging performance compares with that of Mesirow Currency, revealing the following:
In summary, and other things being equal, small funds that do not charge FX hedging fees and have a passive management style have total FX hedging costs that are worse than large funds who do charge FX hedging fees and have an active management style. Strikingly, funds not charging (explicit) FX hedging fees incur total costs that are almost three times larger than funds that do, underlining the importance of looking beyond cost figures as they are reported by fund issuers.
Putting it all together
How can these various effects be explained? In this section, we offer an explanation based on the mechanics of funds’ FX hedging.
To start off, consider a fund’s hedged-share class as an independent portfolio made of:
Now consider the following two scenarios, depending on the movement in US interest rates:
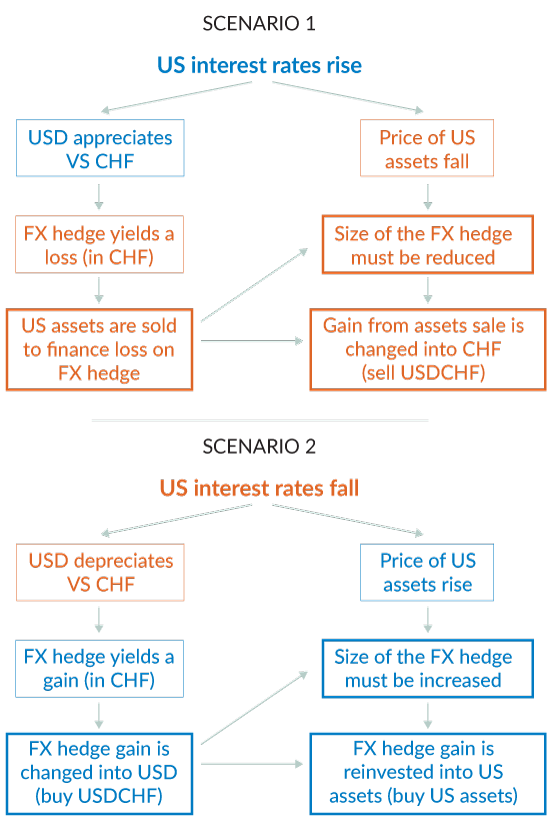
The first thing to note is that, since the share class operates as an isolated compartment, any (realized) gain or loss on the FX hedge requires a buying or selling transaction in the underlying investments to either reinvest the gain or cover the loss. While the fund's management theoretically has discretion over the frequency of these transactions, in practice, they are strongly influenced, sometimes even bound, by the methodology of their reference index.
This methodology is surprisingly similar across the whole range of index providers: at the start of each month, the whole of the FX exposure is hedged using forward contracts with a 1-month maturity. This strategy, while clear and easily reproductible, leads to a large FX hedge turnover, equivalent to 12 times the value of the portfolio per year, resulting in:
Now, let's look at our previous findings considering this hedging methodology.
Recall that funds’ FX hedging performance worsened further in the more recent sub-period. A few computations show that the yearly volatility of US stock and bond returns increased significantly between the two sub-periods, while that of the USDCHF currency pair decreased slightly.
The highlighted hedging methodology implies that the large increase in assets’ volatility (+65% for stocks and +100% for bonds) should have led to larger FX hedge adjustments and thus higher transaction costs in the second sub-period. This aligns with the worsening of the funds’ FX hedging that we observed.
The inefficiencies presented above are known to many market participants and asset managers who can take advantage of them. This excludes passive funds, however, since their task is to replicate the benchmark index’s performance (and thus its FX hedging strategy). On the other hand and as observed in our sample, active funds can boost performance by adapting their hedging process to some degree.
The same logic can apply to funds who charge a higher fee on their hedged share class; they are expected to provide a higher quality service in exchange for this added price compared to the simple replication of an inferior hedging strategy.
Finally, larger funds benefit from more significant resources and economies of scale, allowing them to reduce their transaction costs, resulting in better performance compared to their smaller counterparts.
FX-hedged investment funds are popular for their simplicity as they require no FX hedge management on the part of the investor. However, a closer examination reveals that their inefficient FX hedging methodology and the associated transaction costs have led to continued and significant underperformance over the past decade.
The good news is that a similarly simple yet markedly better solution exists; delegating currency risk management to a specialized manager. This allows for the design of a sound, comprehensive, and efficient hedging program at a low and clear price.
Only this level of transparency can demonstrate a complete alignment of interests with those of the investor.
Delegating currency risk management to a specialized manager allows for the design of an efficient hedging program at a low and clear price.
Connect with us to learn more about Mesirow Currency solutions

Customized solutions to manage unrewarded currency risk in international portfolios.

Strategies that aim to profit from short and medium-term moves in the currency market.

Trading solution for asset managers and owners with focus on reducing transaction costs, improving transparency and enhancing efficiency.
The information contained herein should not be construed as a recommendation to purchase or sell any particular security or investment vehicle offered by Mesirow . The information included has been obtained from sources believed to be reliable, but is not necessarily complete and its accuracy cannot be guaranteed. Any opinions expressed are subject to change without notice. Mesirow Financial Investment Management, Inc. and its affiliated companies and/or individuals may, from time to time, own, have long or short positions in, or options on, or act as a market maker in, any securities discussed herein and may also perform financial advisory or investment banking services for those companies. It should not be assumed that any recommendations incorporated herein will be profitable or will equal past performance. Any stated performance results include the reinvestment of dividends and other earnings. Investment management services offered by Mesirow Financial Investment Management, Inc., an SEC-registered investment advisor.