
Many investors with currency hedging programs face liquidity issues.
They hedge their foreign exchange exposure using a single, short-dated forward contract that must roll and settle the full hedge notional each month. During periods of stress, when the client’s base currency depreciates and a large loss must be settled, the investor may be forced to liquidate investments at an inopportune time.
As an alternative to using monthly contracts or one settlement date, an investor can stagger hedge tenors: holding a ladder of forward contracts with progressively longer maturities that roll on a rotating schedule distributes settlements over time and reduces the concentration of monthly cash flows.
Using more than 25 years of monthly data (January 2001 through July 2026) for an AUD-based investor hedging US dollar exposure, this article quantifies the trade-off introduced by staggering. Relative to a traditional 1-month hedge, staggered structures produce materially smaller and less volatile monthly settlement cash flows. This does, however, come at the cost of a modest and steadily increasing annualized tracking error.
As additional rungs are added to the hedge ladder, from a single 1-month forward (1×1M) to a fully staggered 12-contract, 12-month structure (12×12M), monthly settlement cash flows become progressively smoother (Chart 1), while return dispersion relative to the 1-month benchmark gradually increases.
Investors and overlay managers facing liquidity or operational constraints should weigh the benefit of reduced settlement volatility against the incremental tracking error when determining an appropriate hedge tenor structure.
Throughout this article, performance is evaluated relative to the return of a 1-month forward hedge. This is the standard methodology employed by major index providers, including MSCI, FTSE Russell, and Bloomberg. The 1-month hedge represents the benchmark against which most currency-hedged portfolios are measured.
For investors with explicit tracking-error objectives, understanding the performance implications of staggering hedge maturities is essential when balancing benchmark alignment against improved cash flow management.
The analysis compares twelve staggered hedge structures, denoted 1x1M through 12x12M, where “n x nM” refers to a ladder of n contracts with maturities from one month out to n months, rebalanced on a rotating monthly schedule so that only 1/n of the notional resets in any given month. The 1x1M structure, a single 1-month forward rolled monthly, serves as the benchmark against which tracking error and cumulative deviation are measured.
The sample period runs from January 2001 through July 2026 for the cash flow analysis and for the tracking error and cumulative deviation analyses, each measured against a 1-month forward benchmark return.
Staggering tenors reduces both the typical size and the worst-case size of monthly hedge settlement cash flows. The average absolute monthly cash flow for the AUD-based investor falls from 2.66% of hedged notional under a 1x1M structure to 0.82% under a fully staggered 12x12M structure, a reduction of roughly two-thirds. The improvement in worst case monthly cash flow is even more pronounced: the worst single month falls from -19.46% under 1x1M to -3.12% under 12x12M. This is illustrated in Chart 1.
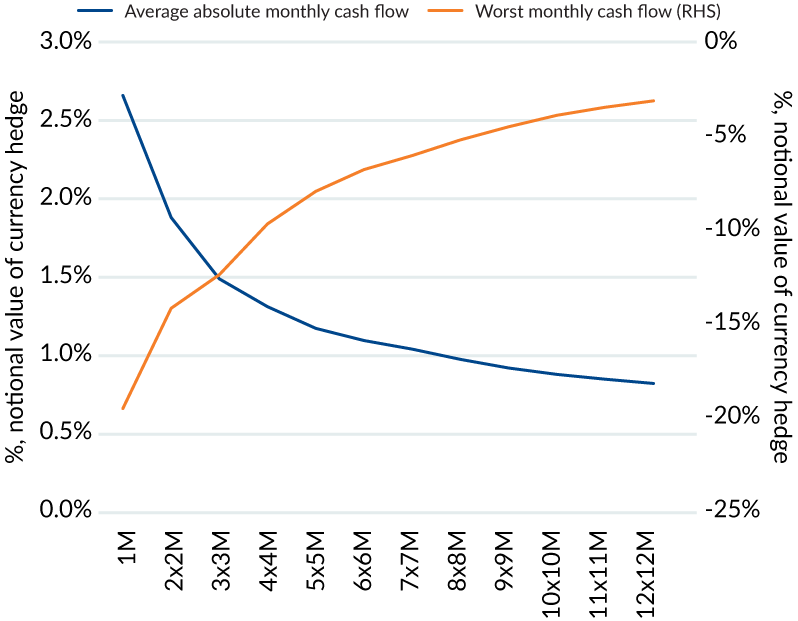
The largest marginal improvement comes from adding just the first few rungs to the ladder: moving from 1x1M to 3x3M cuts the AUD worst-case monthly cash flow by more than 36%, whereas moving from 9x9M to 12x12M yields a small improvement. This suggests that a modest degree of staggering captures most of the available cash flow benefit.
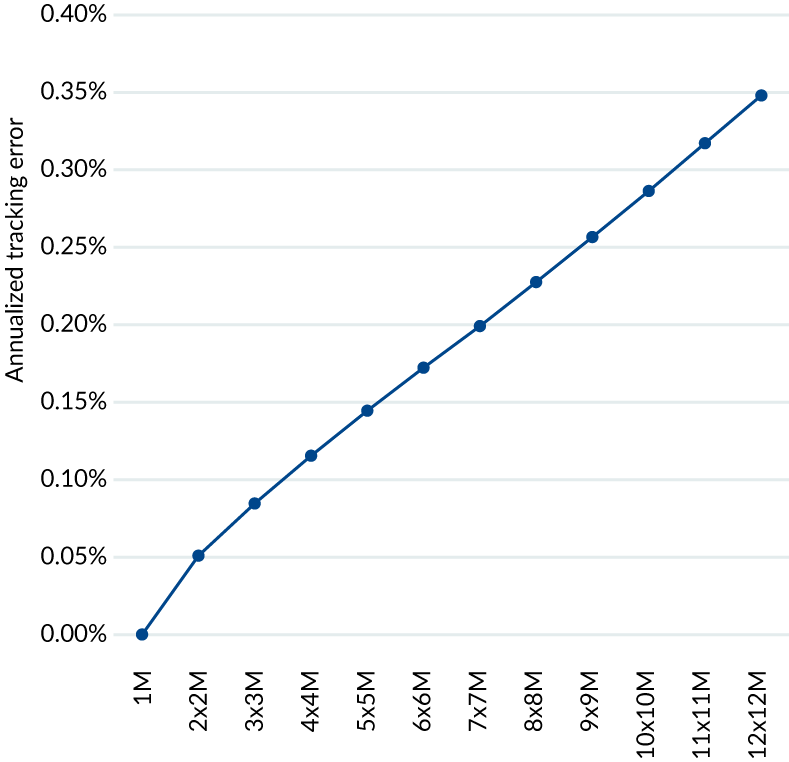
The cash flow benefit is not without its drawbacks, especially for investors who are sensitive to tracking error relative to a published benchmark. Because each staggered structure holds contracts of longer average maturity than the 1-month benchmark, its return path deviates from that benchmark, and annualized tracking error rises steadily as more rungs are added to the ladder.
Tracking error increases in an almost straight line with the number of tenors staggered (Chart 2), reaching roughly 0.35% annualized for the AUD investor at 12x12M. The increase per additional rung is fairly even across the ladder, unlike the cash flow benefit, which is front-loaded, the tracking error cost accrues at a fairly constant rate as tenors are added.
Monthly minimum and maximum deviation from the 1-month benchmark widen as tenors are staggered further, reflecting the wider band of possible monthly outcomes rather than a persistent directional bias as detailed in Table 1. As you can imagine, these large monthly deviations occurred between 2007 and 2009, the period of the Global Financial Crisis.
| Tenor structure | AUD min. deviation | AUD max. deviation |
|---|---|---|
| 3x3M | -0.14% | 0.25% |
| 6x6M | -0.31% | 0.48% |
| 9x9M | -0.49% | 0.59% |
| 12x12M | -0.64% | 0.68% |
Cumulative deviation over the full sample period oscillates around zero throughout the sample and finishes the period only marginally away from the benchmark (Chart 3), consistent with a series of largely offsetting monthly deviations rather than a directional drag.
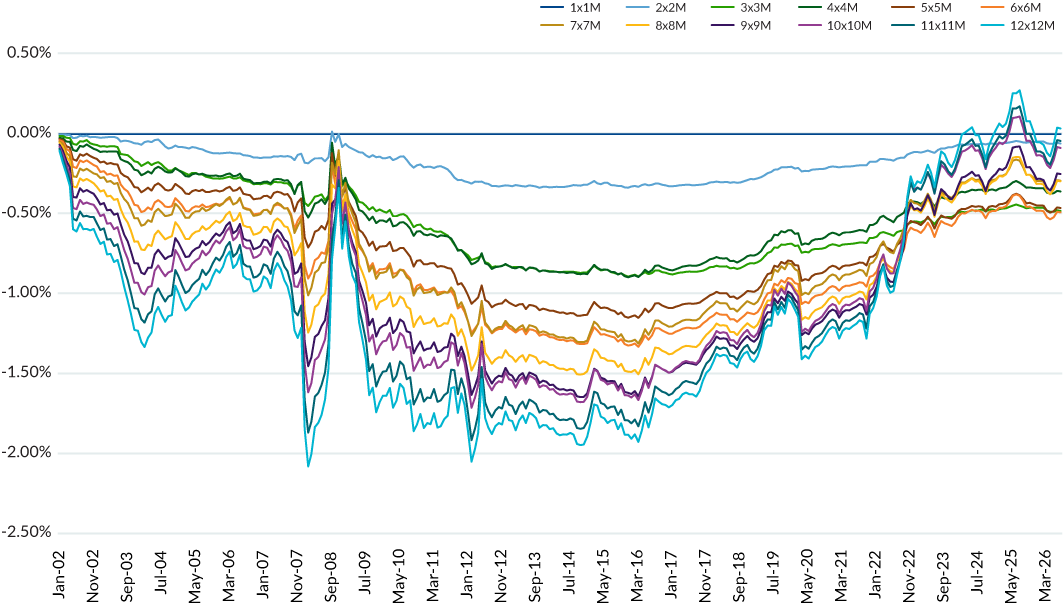
Staggering hedge tenors is an effective lever for reducing the size and volatility of monthly settlement cash flows in a currency overlay program, with the largest gains typically realized from the first few additional rungs on the ladder. That benefit comes paired with a modest, steadily increasing tracking error cost relative to a 1-month hedge benchmark, and the cumulative return impact of that tracking error can, in some periods and currencies, accumulate in one direction rather than average out.
Investors evaluating a staggered tenor structure should size the ladder to the point that meaningfully addresses their cash flow or liquidity constraints, without adding further rungs whose marginal cash flow benefit is small relative to the tracking error and cumulative deviation cost being taken on.
Investors evaluating a staggered hedge tenor structure should size the ladder to the point that meaningfully addresses their cash flow or liquidity constraints.
Connect with us to learn more about Mesirow Currency solutions

Customized solutions to manage unrewarded currency risk in international portfolios.

Strategies that aim to profit from short and medium-term moves in the currency market.

Trading solution for asset managers and owners with focus on reducing transaction costs, improving transparency and enhancing efficiency.
The information contained herein should not be construed as a recommendation to purchase or sell any particular security or investment vehicle offered by Mesirow . The information included has been obtained from sources believed to be reliable, but is not necessarily complete and its accuracy cannot be guaranteed. Any opinions expressed are subject to change without notice. Mesirow Financial Investment Management, Inc. and its affiliated companies and/or individuals may, from time to time, own, have long or short positions in, or options on, or act as a market maker in, any securities discussed herein and may also perform financial advisory or investment banking services for those companies. It should not be assumed that any recommendations incorporated herein will be profitable or will equal past performance. Any stated performance results include the reinvestment of dividends and other earnings. Investment management services offered by Mesirow Financial Investment Management, Inc., an SEC-registered investment advisor.